Seborrheic Keratosis Treatment Size to Grow by USD 786.38 Mn, Cryotherapy to be Largest Revenue-generating Application Segment - Technavio
31 Oct 2022
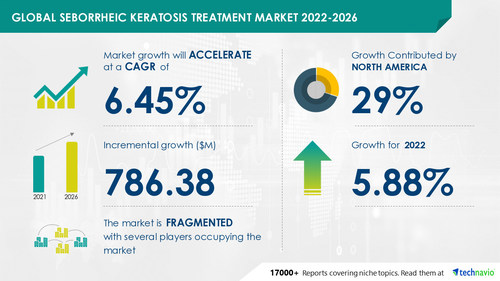
NEW YORK, Oct. 31, 2022 /PRNewswire/ -- The seborrheic keratosis treatment market size is expected to grow by USD 786.38 million from 2021 to 2026. In addition, the growth momentum of the market will accelerate at a CAGR of 6.45% during the forecast period, according to Technavio. The growing preference for the aesthetic quotient is driving the seborrheic keratosis treatment market growth. However, factors such as the lack of approved drug therapies may challenge market growth.
Continue Reading
Preview
Source: PRNewswire
Technavio has announced its latest market research report titled Global Seborrheic Keratosis Treatment Market 2022-2026
This report offers an up-to-date analysis of the current market scenario, the latest trends and drivers, and the overall market environment. Read FREE PDF Sample Report
Seborrheic Keratosis Treatment 2022-2026: Segmentation
Application
Cryotherapy: The cryotherapy segment will be a significant contributor to market growth during the forecast period. Cryotherapy uses the extreme cold produced by liquid nitrogen or argon gas to destroy abnormal tissues. It is used for treating external tumors, such as seborrheic keratosis. The rising prevalence of seborrheic keratosis is increasing the demand for safe and effective treatment, which will propel the growth of the segment.
Electrocautery
Others
Geography
North America: North America will account for 29% of the market's growth during the forecast period. This growth is attributed to factors such as the increasing geriatric population. However, market growth in this region will be slower than the growth of the market in other regions. The US and Canada are the key countries for the seborrheic keratosis treatment market in North America.
Europe
Asia
Rest Of World (ROW)
Learn about the contribution of each segment summarized in concise infographics and thorough descriptions. View a FREE PDF Sample Report
Seborrheic Keratosis Treatment Market 2022-2026: Vendor Analysis and Scope
To help businesses improve their market position, Technavio's report provides a detailed analysis of around 25 vendors operating in the market. Some of the major vendors of the seborrheic keratosis treatment market include Aclaris Therapeutics Inc., BioLineRx Ltd., Brymill Cryogenic Systems, Cortex Technology, Cryo Innovations, CryoConcepts LP, Cryoswiss GmbH, Erbe Elektromedizin GmbH, H and O Equipments, and Special Medical Technology s.r.o.
The report also covers the following areas
:
Seborrheic Keratosis Treatment Market size
Seborrheic Keratosis Treatment Market trends
Seborrheic Keratosis Treatment Market industry analysis
This report provides a full list of key vendors, their strategies, and the latest developments. Buy Now for detailed information about vendors
Seborrheic Keratosis Treatment Market 2022-2026: Key Highlights
CAGR of the market during the forecast period 2022-2026
Detailed information on factors that will assist seborrheic keratosis treatment market growth during the next five years
Estimation of the seborrheic keratosis treatment market size and its contribution to the parent market
Predictions on upcoming trends and changes in consumer behavior
The growth of the seborrheic keratosis treatment market
Analysis of the market's competitive landscape and detailed information on vendors
Comprehensive details of factors that will challenge the growth of seborrheic keratosis treatment market vendors
Get lifetime access to our Technavio Insights. Subscribe now to our most popular "Basic Plan" billed annually at USD 5000. View 100 reports and download 5 reports monthly!
Related Reports
Amyotrophic Lateral Sclerosis Treatment Market by Type and Geography - Forecast and Analysis 2022-2026: This report extensively covers segmentation by type (intravenous and oral) and geography (North America, Europe, Asia, and Rest of World (ROW)). 40% of the market's growth will originate from North America during the forecast period. The market share growth by the intravenous segment will be significant.
Bromhidrosis Disease Treatment Market by Type and Geography - Forecast and Analysis 2022-2026: This report extensively covers segmentation by type (apocrine body odor and eccrine body odor) and geography (North America, Europe, Asia, and Rest of World (ROW)). 38% of the market's growth will originate from North America during the forecast period. The market share growth by the apocrine body odor segment will be significant.
Browse Health Care Market Reports
Table of Contents
1 Executive Summary
1.1 Market overview
Exhibit 01: Executive Summary – Chart on Market Overview
Exhibit 02: Executive Summary – Data Table on Market Overview
Exhibit 03: Executive Summary – Chart on Global Market Characteristics
Exhibit 04: Executive Summary – Chart on Market by Geography
Exhibit 05: Executive Summary – Chart on Market Segmentation by Application
Exhibit 06: Executive Summary – Chart on Incremental Growth
Exhibit 07: Executive Summary – Data Table on Incremental Growth
Exhibit 08: Executive Summary – Chart on Vendor Market Positioning
2 Market Landscape
2.1 Market ecosystem
Exhibit 09: Parent market
Exhibit 10: Market Characteristics
3 Market Sizing
3.1 Market definition
Exhibit 11: Offerings of vendors included in the market definition
3.2 Market segment analysis
Exhibit 12: Market segments
3.3 Market size 2021
3.4 Market outlook: Forecast for 2021-2026
Exhibit 13: Chart on Global - Market size and forecast 2021-2026 ($ million)
Exhibit 14: Data Table on Global - Market size and forecast 2021-2026 ($ million)
Exhibit 15: Chart on Global Market: Year-over-year growth 2021-2026 (%)
Exhibit 16: Data Table on Global Market: Year-over-year growth 2021-2026 (%)
4 Five Forces Analysis
4.1 Five forces summary
Exhibit 17: Five forces analysis - Comparison between 2021 and 2026
4.2 Bargaining power of buyers
Exhibit 18: Chart on Bargaining power of buyers – Impact of key factors 2021 and 2026
4.3 Bargaining power of suppliers
Exhibit 19: Bargaining power of suppliers – Impact of key factors in 2021 and 2026
4.4 Threat of new entrants
Exhibit 20: Threat of new entrants – Impact of key factors in 2021 and 2026
4.5 Threat of substitutes
Exhibit 21: Threat of substitutes – Impact of key factors in 2021 and 2026
4.6 Threat of rivalry
Exhibit 22: Threat of rivalry – Impact of key factors in 2021 and 2026
4.7 Market condition
Exhibit 23: Chart on Market condition - Five forces 2021 and 2026
5 Market Segmentation by Application
5.1 Market segments
Exhibit 24: Chart on Application - Market share 2021-2026 (%)
Exhibit 25: Data Table on Application - Market share 2021-2026 (%)
5.2 Comparison by Application
Exhibit 26: Chart on Comparison by Application
Exhibit 27: Data Table on Comparison by Application
5.3 Cryotherapy - Market size and forecast 2021-2026
Exhibit 28: Chart on Cryotherapy - Market size and forecast 2021-2026 ($ million)
Exhibit 29: Data Table on Cryotherapy - Market size and forecast 2021-2026 ($ million)
Exhibit 30: Chart on Cryotherapy - Year-over-year growth 2021-2026 (%)
Exhibit 31: Data Table on Cryotherapy - Year-over-year growth 2021-2026 (%)
5.4 Electrocautery - Market size and forecast 2021-2026
Exhibit 32: Chart on Electrocautery - Market size and forecast 2021-2026 ($ million)
Exhibit 33: Data Table on Electrocautery - Market size and forecast 2021-2026 ($ million)
Exhibit 34: Chart on Electrocautery - Year-over-year growth 2021-2026 (%)
Exhibit 35: Data Table on Electrocautery - Year-over-year growth 2021-2026 (%)
5.5 Others - Market size and forecast 2021-2026
Exhibit 36: Chart on Others - Market size and forecast 2021-2026 ($ million)
Exhibit 37: Data Table on Others - Market size and forecast 2021-2026 ($ million)
Exhibit 38: Chart on Others - Year-over-year growth 2021-2026 (%)
Exhibit 39: Data Table on Others - Year-over-year growth 2021-2026 (%)
5.6 Market opportunity by Application
Exhibit 40: Market opportunity by Application ($ million)
6 Customer Landscape
6.1 Customer landscape overview
Exhibit 41: Analysis of price sensitivity, lifecycle, customer purchase basket, adoption rates, and purchase criteria
7 Geographic Landscape
7.1 Geographic segmentation
Exhibit 42: Chart on Market share by geography 2021-2026 (%)
Exhibit 43: Data Table on Market share by geography 2021-2026 (%)
7.2 Geographic comparison
Exhibit 44: Chart on Geographic comparison
Exhibit 45: Data Table on Geographic comparison
7.3 North America - Market size and forecast 2021-2026
Exhibit 46: Chart on North America - Market size and forecast 2021-2026 ($ million)
Exhibit 47: Data Table on North America - Market size and forecast 2021-2026 ($ million)
Exhibit 48: Chart on North America - Year-over-year growth 2021-2026 (%)
Exhibit 49: Data Table on North America - Year-over-year growth 2021-2026 (%)
7.4 Europe - Market size and forecast 2021-2026
Exhibit 50: Chart on Europe - Market size and forecast 2021-2026 ($ million)
Exhibit 51: Data Table on Europe - Market size and forecast 2021-2026 ($ million)
Exhibit 52: Chart on Europe - Year-over-year growth 2021-2026 (%)
Exhibit 53: Data Table on Europe - Year-over-year growth 2021-2026 (%)
7.5 Asia - Market size and forecast 2021-2026
Exhibit 54: Chart on Asia - Market size and forecast 2021-2026 ($ million)
Exhibit 55: Data Table on Asia - Market size and forecast 2021-2026 ($ million)
Exhibit 56: Chart on Asia - Year-over-year growth 2021-2026 (%)
Exhibit 57: Data Table on Asia - Year-over-year growth 2021-2026 (%)
7.6 Rest of World (ROW) - Market size and forecast 2021-2026
Exhibit 58: Chart on Rest of World (ROW) - Market size and forecast 2021-2026 ($ million)
Exhibit 59: Data Table on Rest of World (ROW) - Market size and forecast 2021-2026 ($ million)
Exhibit 60: Chart on Rest of World (ROW) - Year-over-year growth 2021-2026 (%)
Exhibit 61: Data Table on Rest of World (ROW) - Year-over-year growth 2021-2026 (%)
7.7 US - Market size and forecast 2021-2026
Exhibit 62: Chart on US - Market size and forecast 2021-2026 ($ million)
Exhibit 63: Data Table on US - Market size and forecast 2021-2026 ($ million)
Exhibit 64: Chart on US - Year-over-year growth 2021-2026 (%)
Exhibit 65: Data Table on US - Year-over-year growth 2021-2026 (%)
7.8 Germany - Market size and forecast 2021-2026
Exhibit 66: Chart on Germany - Market size and forecast 2021-2026 ($ million)
Exhibit 67: Data Table on Germany - Market size and forecast 2021-2026 ($ million)
Exhibit 68: Chart on Germany - Year-over-year growth 2021-2026 (%)
Exhibit 69: Data Table on Germany - Year-over-year growth 2021-2026 (%)
7.9 Japan - Market size and forecast 2021-2026
Exhibit 70: Chart on Japan - Market size and forecast 2021-2026 ($ million)
Exhibit 71: Data Table on Japan - Market size and forecast 2021-2026 ($ million)
Exhibit 72: Chart on Japan - Year-over-year growth 2021-2026 (%)
Exhibit 73: Data Table on Japan - Year-over-year growth 2021-2026 (%)
7.10 Canada - Market size and forecast 2021-2026
Exhibit 74: Chart on Canada - Market size and forecast 2021-2026 ($ million)
Exhibit 75: Data Table on Canada - Market size and forecast 2021-2026 ($ million)
Exhibit 76: Chart on Canada - Year-over-year growth 2021-2026 (%)
Exhibit 77: Data Table on Canada - Year-over-year growth 2021-2026 (%)
7.11 China - Market size and forecast 2021-2026
Exhibit 78: Chart on China - Market size and forecast 2021-2026 ($ million)
Exhibit 79: Data Table on China - Market size and forecast 2021-2026 ($ million)
Exhibit 80: Chart on China - Year-over-year growth 2021-2026 (%)
Exhibit 81: Data Table on China - Year-over-year growth 2021-2026 (%)
7.12 Market opportunity by geography
Exhibit 82: Market opportunity by geography ($ million)
8 Drivers, Challenges, and Trends
8.1 Market drivers
8.2 Market challenges
8.3 Impact of drivers and challenges
Exhibit 83: Impact of drivers and challenges in 2021 and 2026
8.4 Market trends
9 Vendor Landscape
9.1 Overview
9.2 Vendor landscape
Exhibit 84: Overview on Criticality of inputs and Factors of differentiation
9.3 Landscape disruption
Exhibit 85: Overview on factors of disruption
9.4 Industry risks
Exhibit 86: Impact of key risks on business
10 Vendor Analysis
10.1 Vendors covered
Exhibit 87: Vendors covered
10.2 Market positioning of vendors
Exhibit 88: Matrix on vendor position and classification
Exhibit 89: Aclaris Therapeutics Inc. - Overview
Exhibit 90: Aclaris Therapeutics Inc. - Business segments
Exhibit 91: Aclaris Therapeutics Inc. - Key news
Exhibit 92: Aclaris Therapeutics Inc. - Key offerings
Exhibit 93: Aclaris Therapeutics Inc. - Segment focus
10.4 BioLineRx Ltd.
Exhibit 94: BioLineRx Ltd. - Overview
Exhibit 95: BioLineRx Ltd. - Product / Service
Exhibit 96: BioLineRx Ltd. - Key offerings
10.5 Brymill Cryogenic Systems
Exhibit 97: Brymill Cryogenic Systems - Overview
Exhibit 98: Brymill Cryogenic Systems - Product / Service
Exhibit 99: Brymill Cryogenic Systems - Key offerings
10.6 Cortex Technology
Exhibit 100: Cortex Technology - Overview
Exhibit 101: Cortex Technology - Product / Service
Exhibit 102: Cortex Technology - Key offerings
10.7 Cryo Innovations
Exhibit 103: Cryo Innovations - Overview
Exhibit 104: Cryo Innovations - Product / Service
Exhibit 105: Cryo Innovations - Key offerings
10.8 CryoConcepts LP
Exhibit 106: CryoConcepts LP - Overview
Exhibit 107: CryoConcepts LP - Product / Service
Exhibit 108: CryoConcepts LP - Key offerings
10.9 Cryoswiss GmbH
Exhibit 109: Cryoswiss GmbH - Overview
Exhibit 110: Cryoswiss GmbH - Product / Service
Exhibit 111: Cryoswiss GmbH - Key offerings
10.10 Erbe Elektromedizin GmbH
Exhibit 112: Erbe Elektromedizin GmbH - Overview
Exhibit 113: Erbe Elektromedizin GmbH - Product / Service
Exhibit 114: Erbe Elektromedizin GmbH - Key offerings
10.11 H and O Equipments
Exhibit 115: H and O Equipments - Overview
Exhibit 116: H and O Equipments - Product / Service
Exhibit 117: H and O Equipments - Key offerings
Exhibit 118: Special Medical Technology s.r.o - Overview
Exhibit 119: Special Medical Technology s.r.o - Product / Service
Exhibit 120: Special Medical Technology s.r.o - Key offerings
11.1 Scope of the report
11.2 Inclusions and exclusions checklist
Exhibit 121: Inclusions checklist
Exhibit 122: Exclusions checklist
11.3 Currency conversion rates for US$
Exhibit 123: Currency conversion rates for US$
11.4 Research methodology
Exhibit 124: Research methodology
Exhibit 125: Validation techniques employed for market sizing
Exhibit 126: Information sources
11.5 List of abbreviations
Exhibit 127: List of abbreviations
About Us
Technavio is a leading global technology research and advisory company. Their research and analysis focus on emerging market trends and provide actionable insights to help businesses identify market opportunities and develop effective strategies to optimize their market positions. With over 500 specialized analysts, Technavio's report library consists of more than 17,000 reports and counting, covering 800 technologies, spanning across 50 countries. Their client base consists of enterprises of all sizes, including more than 100 Fortune 500 companies. This growing client base relies on Technavio's comprehensive coverage, extensive research, and actionable market insights to identify opportunities in existing and potential markets and assess their competitive positions within changing market scenarios.
Contact
Technavio Research
Jesse Maida
US: +1 844 364 1100
UK: +44 203 893 3200
Email: [email protected]
Website: www.technavio.com/
SOURCE Technavio
For more details,please visit the original website
The content of the article does not represent any opinions of Synapse and its affiliated companies. If there is any copyright infringement or error, please contact us, and we will deal with it within 24 hours.
Organizations
Targets
-Drugs
-Hot reports


Get started for free today!
Accelerate Strategic R&D decision making with Synapse, PatSnap’s AI-powered Connected Innovation Intelligence Platform Built for Life Sciences Professionals.
Start your data trial now!
Synapse data is also accessible to external entities via APIs or data packages. Leverages most recent intelligence information, enabling fullest potential.