What are the Key Vendors in the Rheumatoid Arthritis Diagnostic Devices Market? Get All your Questions Answered by Technavio
23 Aug 2022
Antibody
NEW YORK, Aug. 23, 2022 /PRNewswire/ -- The growth of the global rheumatoid arthritis diagnostic devices market is driven by factors such as the
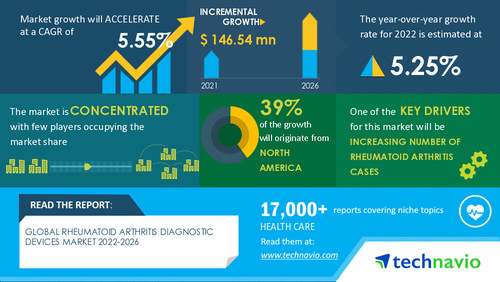
increasing number of rheumatoid arthritis cases. Rheumatoid arthritis is more common among the elderly population. Hence, the demand for rheumatoid arthritis diagnostic devices is increasing. In addition, countries across the world have started to establish programs to increase awareness about rheumatoid arthritis. Such programs also create awareness about diagnostic procedures and treatment plans. Some European countries, such as the UK and France, offer reimbursement for rheumatoid arthritis, which will boost the adoption of rheumatoid arthritis diagnostic devices. Moreover, the presence of public and private health insurance providers in several countries contributes to market growth.
Continue Reading
Preview
Source: PRNewswire
Latest market research report titled Rheumatoid Arthritis Diagnostic Devices Market by Product and Geography - Forecast and Analysis 2022-2026 has been announced by Technavio which is proudly partnering with Fortune 500 companies for over 16 years
The global rheumatoid arthritis diagnostic devices market size is expected to grow by USD 146.54 mn from 2021 to 2026, according to Technavio. Moreover, the growth momentum of the market will accelerate at a CAGR of 5.55% during the forecast period.
Make confident decisions using the insights and analysis provided by Technavio.
Download a FREE PDF Sample Report
Key Market Challenges
The
high costs associated with rheumatoid arthritis diagnosis will challenge the rheumatoid arthritis diagnostic devices market during the forecast period. The rising prevalence of rheumatoid arthritis will fuel the demand for rheumatoid arthritis diagnostic devices. However, the cost of these devices is high, which can hamper their adoption. For instance, the average cost of rheumatoid arthritis diagnostic analyzers is from USD 8,000 to USD 15,000, based on the technology and applications. In addition, the use of consumables such as assays and test kits can increase the cost burden on end-users, particularly small and medium-sized diagnostic service providers. Hence, the high cost associated with the diagnosis of rheumatoid arthritis can negatively impact the adoption of diagnostic devices, which, in turn, can impede the adoption of diagnostic services.
Major Rheumatoid Arthritis Diagnostic Device Companies
Svar Life Science AB
Get lifetime access to our Technavio Insights! Subscribe to our
"Basic Plan" billed annually at USD 5000!
Rheumatoid Arthritis Diagnostic Devices Market Product Outlook (Revenue, USD mn, 2021-2026)
Analyzers - size and forecast 2021-2026
Consumables - size and forecast 2021-2026
Rheumatoid Arthritis Diagnostic Devices Market Geography Outlook (Revenue, USD mn, 2021-2026)
North America - size and forecast 2021-2026
Europe - size and forecast 2021-2026
Asia - size and forecast 2021-2026
Rest of World (ROW) - size and forecast 2021-2026
Learn about the contribution of each segment summarized in concise infographics and thorough descriptions.
View a FREE PDF Sample Report
North America will account for 39% of the market's growth during the forecast period. The growth of this region is attributed to factors such as the rising number of people with rheumatoid arthritis, the increasing number of new product launches, the growing adoption of early diagnostic tests for rheumatoid arthritis, and the availability of public and private insurance for rheumatoid arthritis tests. However, market growth in this region will be slower than the growth of the market in other regions. The US and Canada are the key countries for the rheumatoid arthritis diagnostic devices market in North America.
Related Reports
Ankle Replacement (Arthroplasty) Market by Application and Geography - Forecast and Analysis 2021-2025
Electric Wheelchairs Market by Product and Geography - Forecast and Analysis 2021-2025
Browse
Consumer Discretionary
Market Reports
Table of Contents
1 Executive Summary
1.1 Market overview
Exhibit 01: Executive Summary – Chart on Market Overview
Exhibit 02: Executive Summary – Data Table on Market Overview
Exhibit 03: Executive Summary – Chart on Global Market Characteristics
Exhibit 04: Executive Summary – Chart on Market by Geography
Exhibit 05: Executive Summary – Chart on Market Segmentation by Product
Exhibit 06: Executive Summary – Chart on Incremental Growth
Exhibit 07: Executive Summary – Data Table on Incremental Growth
Exhibit 08: Executive Summary – Chart on Vendor Market Positioning
2 Market Landscape
2.1 Market ecosystem
Exhibit 09: Parent market
Exhibit 10: Market Characteristics
3 Market Sizing
3.1 Market definition
Exhibit 11: Offerings of vendors included in the market definition
3.2 Market segment analysis
Exhibit 12: Market segments
3.3 Market size 2021
3.4 Market outlook: Forecast for 2021-2026
Exhibit 13: Chart on Global - Market size and forecast 2021-2026 ($ million)
Exhibit 14: Data Table on Global - Market size and forecast 2021-2026 ($ million)
Exhibit 15: Chart on Global Market: Year-over-year growth 2021-2026 (%)
Exhibit 16: Data Table on Global Market: Year-over-year growth 2021-2026 (%)
4 Five Forces Analysis
4.1 Five forces summary
Exhibit 17: Five forces analysis - Comparison between 2021 and 2026
4.2 Bargaining power of buyers
Exhibit 18: Chart on Bargaining power of buyers – Impact of key factors 2021 and 2026
4.3 Bargaining power of suppliers
Exhibit 19: Bargaining power of suppliers – Impact of key factors in 2021 and 2026
4.4 Threat of new entrants
Exhibit 20: Threat of new entrants – Impact of key factors in 2021 and 2026
4.5 Threat of substitutes
Exhibit 21: Threat of substitutes – Impact of key factors in 2021 and 2026
4.6 Threat of rivalry
Exhibit 22: Threat of rivalry – Impact of key factors in 2021 and 2026
4.7 Market condition
Exhibit 23: Chart on Market condition - Five forces 2021 and 2026
5 Market Segmentation by Product
5.1 Market segments
Exhibit 24: Chart on Product - Market share 2021-2026 (%)
Exhibit 25: Data Table on Product - Market share 2021-2026 (%)
5.2 Comparison by Product
Exhibit 26: Chart on Comparison by Product
Exhibit 27: Data Table on Comparison by Product
5.3 Analyzers - Market size and forecast 2021-2026
Exhibit 28: Chart on Analyzers - Market size and forecast 2021-2026 ($ million)
Exhibit 29: Data Table on Analyzers - Market size and forecast 2021-2026 ($ million)
Exhibit 30: Chart on Analyzers - Year-over-year growth 2021-2026 (%)
Exhibit 31: Data Table on Analyzers - Year-over-year growth 2021-2026 (%)
5.4 Consumables - Market size and forecast 2021-2026
Exhibit 32: Chart on Consumables - Market size and forecast 2021-2026 ($ million)
Exhibit 33: Data Table on Consumables - Market size and forecast 2021-2026 ($ million)
Exhibit 34: Chart on Consumables - Year-over-year growth 2021-2026 (%)
Exhibit 35: Data Table on Consumables - Year-over-year growth 2021-2026 (%)
5.5 Market opportunity by Product
Exhibit 36: Market opportunity by Product ($ million)
6 Customer Landscape
6.1 Customer landscape overview
Exhibit 37: Analysis of price sensitivity, lifecycle, customer purchase basket, adoption rates, and purchase criteria
7 Geographic Landscape
7.1 Geographic segmentation
Exhibit 38: Chart on Market share by geography 2021-2026 (%)
Exhibit 39: Data Table on Market share by geography 2021-2026 (%)
7.2 Geographic comparison
Exhibit 40: Chart on Geographic comparison
Exhibit 41: Data Table on Geographic comparison
7.3 North America - Market size and forecast 2021-2026
Exhibit 42: Chart on North America - Market size and forecast 2021-2026 ($ million)
Exhibit 43: Data Table on North America - Market size and forecast 2021-2026 ($ million)
Exhibit 44: Chart on North America - Year-over-year growth 2021-2026 (%)
Exhibit 45: Data Table on North America - Year-over-year growth 2021-2026 (%)
7.4 Europe - Market size and forecast 2021-2026
Exhibit 46: Chart on Europe - Market size and forecast 2021-2026 ($ million)
Exhibit 47: Data Table on Europe - Market size and forecast 2021-2026 ($ million)
Exhibit 48: Chart on Europe - Year-over-year growth 2021-2026 (%)
Exhibit 49: Data Table on Europe - Year-over-year growth 2021-2026 (%)
7.5 Asia - Market size and forecast 2021-2026
Exhibit 50: Chart on Asia - Market size and forecast 2021-2026 ($ million)
Exhibit 51: Data Table on Asia - Market size and forecast 2021-2026 ($ million)
Exhibit 52: Chart on Asia - Year-over-year growth 2021-2026 (%)
Exhibit 53: Data Table on Asia - Year-over-year growth 2021-2026 (%)
7.6 Rest of World (ROW) - Market size and forecast 2021-2026
Exhibit 54: Chart on Rest of World (ROW) - Market size and forecast 2021-2026 ($ million)
Exhibit 55: Data Table on Rest of World (ROW) - Market size and forecast 2021-2026 ($ million)
Exhibit 56: Chart on Rest of World (ROW) - Year-over-year growth 2021-2026 (%)
Exhibit 57: Data Table on Rest of World (ROW) - Year-over-year growth 2021-2026 (%)
7.7 US - Market size and forecast 2021-2026
Exhibit 58: Chart on US - Market size and forecast 2021-2026 ($ million)
Exhibit 59: Data Table on US - Market size and forecast 2021-2026 ($ million)
Exhibit 60: Chart on US - Year-over-year growth 2021-2026 (%)
Exhibit 61: Data Table on US - Year-over-year growth 2021-2026 (%)
7.8 Germany - Market size and forecast 2021-2026
Exhibit 62: Chart on Germany - Market size and forecast 2021-2026 ($ million)
Exhibit 63: Data Table on Germany - Market size and forecast 2021-2026 ($ million)
Exhibit 64: Chart on Germany - Year-over-year growth 2021-2026 (%)
Exhibit 65: Data Table on Germany - Year-over-year growth 2021-2026 (%)
7.9 France - Market size and forecast 2021-2026
Exhibit 66: Chart on France - Market size and forecast 2021-2026 ($ million)
Exhibit 67: Data Table on France - Market size and forecast 2021-2026 ($ million)
Exhibit 68: Chart on France - Year-over-year growth 2021-2026 (%)
Exhibit 69: Data Table on France - Year-over-year growth 2021-2026 (%)
7.10 Canada - Market size and forecast 2021-2026
Exhibit 70: Chart on Canada - Market size and forecast 2021-2026 ($ million)
Exhibit 71: Data Table on Canada - Market size and forecast 2021-2026 ($ million)
Exhibit 72: Chart on Canada - Year-over-year growth 2021-2026 (%)
Exhibit 73: Data Table on Canada - Year-over-year growth 2021-2026 (%)
7.11 Japan - Market size and forecast 2021-2026
Exhibit 74: Chart on Japan - Market size and forecast 2021-2026 ($ million)
Exhibit 75: Data Table on Japan - Market size and forecast 2021-2026 ($ million)
Exhibit 76: Chart on Japan - Year-over-year growth 2021-2026 (%)
Exhibit 77: Data Table on Japan - Year-over-year growth 2021-2026 (%)
7.12 Market opportunity by geography
Exhibit 78: Market opportunity by geography ($ million)
8 Drivers, Challenges, and Trends
8.1 Market drivers
8.2 Market challenges
8.3 Impact of drivers and challenges
Exhibit 79: Impact of drivers and challenges in 2021 and 2026
8.4 Market trends
9 Vendor Landscape
9.1 Overview
9.2 Vendor landscape
Exhibit 80: Overview on Criticality of inputs and Factors of differentiation
9.3 Landscape disruption
Exhibit 81: Overview on factors of disruption
9.4 Industry risks
Exhibit 82: Impact of key risks on business
10 Vendor Analysis
10.1 Vendors covered
Exhibit 83: Vendors covered
10.2 Market positioning of vendors
Exhibit 84: Matrix on vendor position and classification
10.3 Abbott Laboratories
Exhibit 85: Abbott Laboratories - Overview
Exhibit 86: Abbott Laboratories - Business segments
Exhibit 87: Abbott Laboratories - Key news
Exhibit 88: Abbott Laboratories - Key offerings
Exhibit 89: Abbott Laboratories - Segment focus
10.4 Antibodies Inc.
Exhibit 90: Antibodies Inc. - Overview
Exhibit 91: Antibodies Inc. - Product / Service
Exhibit 92: Antibodies Inc. - Key offerings
Exhibit 93: Aviva Systems Biology Corp. - Overview
Exhibit 94: Aviva Systems Biology Corp. - Product / Service
Exhibit 95: Aviva Systems Biology Corp. - Key offerings
10.6 Bio Rad Laboratories Inc.
Exhibit 96: Bio Rad Laboratories Inc. - Overview
Exhibit 97: Bio Rad Laboratories Inc. - Business segments
Exhibit 98: Bio Rad Laboratories Inc. - Key news
Exhibit 99: Bio Rad Laboratories Inc. - Key offerings
Exhibit 100: Bio Rad Laboratories Inc. - Segment focus
10.7 Danaher Corp.
Exhibit 101: Danaher Corp. - Overview
Exhibit 102: Danaher Corp. - Business segments
Exhibit 103: Danaher Corp. - Key news
Exhibit 104: Danaher Corp. - Key offerings
Exhibit 105: Danaher Corp. - Segment focus
10.8 DNAlytics SA
Exhibit 106: DNAlytics SA - Overview
Exhibit 107: DNAlytics SA - Key offerings
Exhibit 108: F. Hoffmann La Roche Ltd. - Overview
Exhibit 109: F. Hoffmann La Roche Ltd. - Business segments
Exhibit 110: F. Hoffmann La Roche Ltd. - Key news
Exhibit 111: F. Hoffmann La Roche Ltd. - Key offerings
Exhibit 112: F. Hoffmann La Roche Ltd. - Segment focus
10.10 Myriad Genetics Inc.
Exhibit 113: Myriad Genetics Inc. - Overview
Exhibit 114: Myriad Genetics Inc. - Product / Service
Exhibit 115: Myriad Genetics Inc. - Key offerings
10.11 Siemens AG
Exhibit 116: Siemens AG - Overview
Exhibit 117: Siemens AG - Business segments
Exhibit 118: Siemens AG - Key news
Exhibit 119: Siemens AG - Key offerings
Exhibit 120: Siemens AG - Segment focus
Exhibit 121: Thermo Fisher Scientific Inc. - Overview
Exhibit 122: Thermo Fisher Scientific Inc. - Business segments
Exhibit 123: Thermo Fisher Scientific Inc. - Key news
Exhibit 124: Thermo Fisher Scientific Inc. - Key offerings
Exhibit 125: Thermo Fisher Scientific Inc. - Segment focus
11.1 Scope of the report
11.2 Inclusions and exclusions checklist
Exhibit 126: Inclusions checklist
Exhibit 127: Exclusions checklist
11.3 Currency conversion rates for US$
Exhibit 128: Currency conversion rates for US$
11.4 Research methodology
Exhibit 129: Research methodology
Exhibit 130: Validation techniques employed for market sizing
Exhibit 131: Information sources
11.5 List of abbreviations
Exhibit 132: List of abbreviations
About Technavio
Technavio is a leading global technology research and advisory company. Their research and analysis focus on emerging market trends and provide actionable insights to help businesses identify market opportunities and develop effective strategies to optimize their market positions.
With over 500 specialized analysts, Technavio's report library consists of more than 17,000 reports and counting, covering 800 technologies, spanning across 50 countries. Their client base consists of enterprises of all sizes, including more than 100 Fortune 500 companies. This growing client base relies on Technavio's comprehensive coverage, extensive research, and actionable market insights to identify opportunities in existing and potential markets and assess their competitive positions within changing market scenarios.
Contacts
Technavio Research
Jesse Maida
US: +1 844 364 1100
UK: +44 203 893 3200
Email: [email protected]
Website: www.technavio.com/
SOURCE Technavio
For more details,please visit the original website
The content of the article does not represent any opinions of Synapse and its affiliated companies. If there is any copyright infringement or error, please contact us, and we will deal with it within 24 hours.
Organizations
Indications
Targets
-Drugs
-Hot reports


Get started for free today!
Accelerate Strategic R&D decision making with Synapse, PatSnap’s AI-powered Connected Innovation Intelligence Platform Built for Life Sciences Professionals.
Start your data trial now!
Synapse data is also accessible to external entities via APIs or data packages. Leverages most recent intelligence information, enabling fullest potential.