The Assisted Reproductive Technology Market size to grow at a CAGR of 5.79% from 2022 to 2027- Technavio
30 Oct 2023
NEW YORK, Oct. 30, 2023 /PRNewswire/ -- The
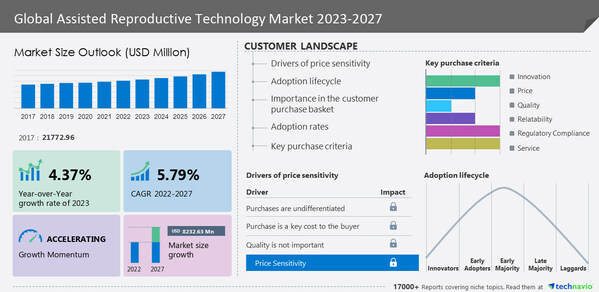
global assisted reproductive technology market size is estimated to grow by
USD 8,232.63 million from 2022 to 2027, according to Technavio. The market is estimated to grow at a
CAGR of 5.79% during the forecast period.
Europe is going to have lucrative growth during the forecast period. About
32% of the market's overall growth is expected to originate from Europe. The rising elderly population facing infertility issues, particularly due to declining egg quality in women, is a significant factor driving the demand for assisted reproductive technology (ART) in Europe. Also, countries like Italy, the UK, Germany, France, and Spain are key contributors to this trend. Additionally, favorable reimbursement policies and the availability of advanced ART techniques further support the growth of the fertility treatment market in the region. Hence, such factors are expected to drive segment growth in the market during the forecast period.
For more insights on the historic period (2017 to 2021) and forecast market size (2023 to 2027) - Request a sample report
Continue Reading
Preview
Source: PRNewswire
Technavio has announced its latest market research report titled Global Assisted Reproductive Technology Market 2023-2027
What's New?
Special coverage on the Russia-Ukraine war; global inflation; recovery analysis from COVID-19; supply chain disruptions, global trade tensions; and risk of recession
Global competitiveness and key competitor positions
Market presence across multiple geographical footprints - Strong/Active/Niche/Trivial -
buy the report!
Assisted Reproductive Technology Market - Segmentation Assessment
Segment Overview
This market research report segments the assisted reproductive technology market by application (fertility clinics, hospitals, and others), type (IVF and artificial insemination), and geography (Europe, North America, Asia, and the Rest of the World (ROW)).
The
fertility clinics segment is significant during the forecast period. The growth of the fertility clinics segment is driven by factors like the increased number of fertility centers to meet the unmet demand and the rising number of fertility patients seeking treatment. Hence, factors such as the success of such fertility clinics are expected to drive segment growth in the market during the forecast period.
Insights on the market contribution of various segments, including country and region wise historic data (2017 to 2021) and forecast market size (2023 to 2027) - Download a Sample Report
Assisted Reproductive Technology Market –
Market Dynamics
Key factor driving market growth
The growing awareness of ART is a major factor driving the growth of the market. The increasing use of assisted reproductive technology (ART) can be attributed to several crucial factors, including changing public perceptions, increasing infertility rates, and advances in ART technology. Since awareness of the benefits of ART has grown, barriers have been removed, and social stigma has decreased, fertility treatment has become more accessible to individuals and couples. Hence, such factors are expected to drive market growth during the forecast period.
Leading trends influencing the market
The increasing number of single-parent families is an emerging trend in the market. The increasing acceptance of single-parent families as well as rising divorce rates, have led to a significant increase in the use of fertility clinics by single women around the world. Also, counseling and other initiatives have helped the single parent overcome obstacles such as finances and stress and facilitated access to health insurance and choice of ART procedures to build a family. Hence, such trends are expected to drive market growth during the forecast period.
Major challenges hindering the market growth
The side effects of infertility treatment are a significant challenge hindering market growth. Since the use of assisted reproductive technology increases, there is growing concern about potential side effects on the patient's overall health. Additionally, women undergoing IVF and related treatments may experience stress, complications, and risk of multiple pregnancies. Additionally, such procedures cause side effects such as nausea, vomiting, shortness of breath, and severe abdominal pain after procedures. Hence, side effects are expected to impede market growth during the forecast period.
Insights on Market Drivers, trends, & Challenges, historic period(2017 to 2021), and forecast period(2023 to 2027)- Request a sample report!
What are the key data covered in this Assisted Reproductive Technology Market report?
CAGR of the market during the forecast period
Detailed information on factors that will drive the growth of the assisted reproductive technology market between 2023 and 2027
Precise estimation of the size of the assisted reproductive technology market and its contribution to the market with a focus on the parent market
Accurate predictions about upcoming trends and changes in consumer behavior
Growth of the assisted reproductive technology market across Europe, North America, Asia, and Rest of World (ROW)
A thorough analysis of the market's competitive landscape and detailed information about vendors
Comprehensive analysis of factors that will challenge the growth of assisted reproductive technology market vendors
Gain instant access to 17,000+ market research reports.
Technavio's SUBSCRIPTION platform
Related Reports:
The
Duchenne muscular dystrophy (DMD) therapeutics market is estimated to grow by USD 2,397.67 million at a CAGR of 21.2% between 2022 and 2027. Furthermore, this report extensively covers market segmentation by type (biologics and small molecules), distribution channel (offline and online), and geography (North America, Europe, Asia, and the Rest of the World (ROW)). The high unmet need among patients with Duchenne muscular dystrophy (DMD) is a key factor driving market growth during the forecast period.
The
photodynamic therapy market is estimated to grow by USD 2,053.68 million at a CAGR of 8.22% between 2022 and 2027. Furthermore, this report extensively covers market segmentation by application (cancer, actinic keratosis, psoriasis, acne, and others), product (photosensitizer drugs, and photodynamic therapy devices), and geography (North America, Europe, Asia, and the Rest of the World (ROW)). Early detection of cancer is a key factor driving market growth during the forecast period.
Table of Contents
1 Executive Summary
1.1 Market Overview
Exhibit 01: Executive Summary – Chart on Market Overview
Exhibit 02: Executive Summary – Data Table on Market Overview
Exhibit 03: Executive Summary – Chart on Global Market Characteristics
Exhibit 04: Executive Summary – Chart on Market by Geography
Exhibit 05: Executive Summary – Chart on Market Segmentation by Application
Exhibit 06: Executive Summary – Chart on Market Segmentation by Type
Exhibit 07: Executive Summary – Chart on Incremental Growth
Exhibit 08: Executive Summary – Data Table on Incremental Growth
Exhibit 09: Executive Summary – Chart on Company Market Positioning
2 Market Landscape
2.1 Market ecosystem
Exhibit 10: Parent market
Exhibit 11: Market Characteristics
3 Market Sizing
3.1 Market Definition
Exhibit 12: Offerings of companies included in the market definition
3.2 Market segment analysis
Exhibit 13: Market segments
3.3 Market size 2022
3.4 Market outlook: Forecast for 2022-2027
Exhibit 14: Chart on Global - Market size and forecast 2022-2027 (USD million)
Exhibit 15: Data Table on Global - Market size and forecast 2022-2027 (USD million)
Exhibit 16: Chart on Global Market: Year-over-year growth 2022-2027 (%)
Exhibit 17: Data Table on Global Market: Year-over-year growth 2022-2027 (%)
4 Historic Market Size
4.1 Global assisted reproductive technology market 2017 - 2021
Exhibit 18: Historic Market Size – Data Table on global assisted reproductive technology market 2017 - 2021 (USD million)
4.2 Application Segment Analysis 2017 - 2021
Exhibit 19: Historic Market Size – Application Segment 2017 - 2021 (USD million)
4.3 Type Segment Analysis 2017 - 2021
Exhibit 20: Historic Market Size – Type Segment 2017 - 2021 (USD million)
4.4 Geography Segment Analysis 2017 - 2021
Exhibit 21: Historic Market Size – Geography Segment 2017 - 2021 (USD million)
4.5 Country Segment Analysis 2017 - 2021
Exhibit 22: Historic Market Size – Country Segment 2017 - 2021 (USD million)
5 Five Forces Analysis
5.1 Five forces summary
Exhibit 23: Five forces analysis - Comparison between 2022 and 2027
5.2 Bargaining power of buyers
Exhibit 24: Chart on Bargaining power of buyers – Impact of key factors 2022 and 2027
5.3 Bargaining power of suppliers
Exhibit 25: Bargaining power of suppliers – Impact of key factors in 2022 and 2027
5.4 Threat of new entrants
Exhibit 26: Threat of new entrants – Impact of key factors in 2022 and 2027
5.5 Threat of substitutes
Exhibit 27: Threat of substitutes – Impact of key factors in 2022 and 2027
5.6 Threat of rivalry
Exhibit 28: Threat of rivalry – Impact of key factors in 2022 and 2027
5.7 Market condition
Exhibit 29: Chart on Market condition - Five forces 2022 and 2027
6 Market Segmentation by Application
6.1 Market segments
Exhibit 30: Chart on Application - Market share 2022-2027 (%)
Exhibit 31: Data Table on Application - Market share 2022-2027 (%)
6.2 Comparison by Application
Exhibit 32: Chart on Comparison by Application
Exhibit 33: Data Table on Comparison by Application
6.3 Fertility clinics - Market size and forecast 2022-2027
Exhibit 34: Chart on Fertility clinics - Market size and forecast 2022-2027 (USD million)
Exhibit 35: Data Table on Fertility clinics - Market size and forecast 2022-2027 (USD million)
Exhibit 36: Chart on Fertility clinics - Year-over-year growth 2022-2027 (%)
Exhibit 37: Data Table on Fertility clinics - Year-over-year growth 2022-2027 (%)
6.4 Hospitals - Market size and forecast 2022-2027
Exhibit 38: Chart on Hospitals - Market size and forecast 2022-2027 (USD million)
Exhibit 39: Data Table on Hospitals - Market size and forecast 2022-2027 (USD million)
Exhibit 40: Chart on Hospitals - Year-over-year growth 2022-2027 (%)
Exhibit 41: Data Table on Hospitals - Year-over-year growth 2022-2027 (%)
6.5 Others - Market size and forecast 2022-2027
Exhibit 42: Chart on Others - Market size and forecast 2022-2027 (USD million)
Exhibit 43: Data Table on Others - Market size and forecast 2022-2027 (USD million)
Exhibit 44: Chart on Others - Year-over-year growth 2022-2027 (%)
Exhibit 45: Data Table on Others - Year-over-year growth 2022-2027 (%)
6.6 Market opportunity by Application
Exhibit 46: Market opportunity by Application (USD million)
Exhibit 47: Data Table on Market opportunity by Application (USD million)
7 Market Segmentation by Type
7.1 Market segments
Exhibit 48: Chart on Type - Market share 2022-2027 (%)
Exhibit 49: Data Table on Type - Market share 2022-2027 (%)
7.2 Comparison by Type
Exhibit 50: Chart on Comparison by Type
Exhibit 51: Data Table on Comparison by Type
7.3 IVF - Market size and forecast 2022-2027
Exhibit 52: Chart on IVF - Market size and forecast 2022-2027 (USD million)
Exhibit 53: Data Table on IVF - Market size and forecast 2022-2027 (USD million)
Exhibit 54: Chart on IVF - Year-over-year growth 2022-2027 (%)
Exhibit 55: Data Table on IVF - Year-over-year growth 2022-2027 (%)
7.4 Artificial insemination - Market size and forecast 2022-2027
Exhibit 56: Chart on Artificial insemination - Market size and forecast 2022-2027 (USD million)
Exhibit 57: Data Table on Artificial insemination - Market size and forecast 2022-2027 (USD million)
Exhibit 58: Chart on Artificial insemination - Year-over-year growth 2022-2027 (%)
Exhibit 59: Data Table on Artificial insemination - Year-over-year growth 2022-2027 (%)
7.5 Market opportunity by Type
Exhibit 60: Market opportunity by Type (USD million)
Exhibit 61: Data Table on Market opportunity by Type (USD million)
8 Customer Landscape
8.1 Customer landscape overview
Exhibit 62: Analysis of price sensitivity, lifecycle, customer purchase basket, adoption rates, and purchase criteria
9 Geographic Landscape
9.1 Geographic segmentation
Exhibit 63: Chart on Market share by geography 2022-2027 (%)
Exhibit 64: Data Table on Market share by geography 2022-2027 (%)
9.2 Geographic comparison
Exhibit 65: Chart on Geographic comparison
Exhibit 66: Data Table on Geographic comparison
9.3 Europe - Market size and forecast 2022-2027
Exhibit 67: Chart on Europe - Market size and forecast 2022-2027 (USD million)
Exhibit 68: Data Table on Europe - Market size and forecast 2022-2027 (USD million)
Exhibit 69: Chart on Europe - Year-over-year growth 2022-2027 (%)
Exhibit 70: Data Table on Europe - Year-over-year growth 2022-2027 (%)
9.4 North America - Market size and forecast 2022-2027
Exhibit 71: Chart on North America - Market size and forecast 2022-2027 (USD million)
Exhibit 72: Data Table on North America - Market size and forecast 2022-2027 (USD million)
Exhibit 73: Chart on North America - Year-over-year growth 2022-2027 (%)
Exhibit 74: Data Table on North America - Year-over-year growth 2022-2027 (%)
9.5 Asia - Market size and forecast 2022-2027
Exhibit 75: Chart on Asia - Market size and forecast 2022-2027 (USD million)
Exhibit 76: Data Table on Asia - Market size and forecast 2022-2027 (USD million)
Exhibit 77: Chart on Asia - Year-over-year growth 2022-2027 (%)
Exhibit 78: Data Table on Asia - Year-over-year growth 2022-2027 (%)
9.6 Rest of World (ROW) - Market size and forecast 2022-2027
Exhibit 79: Chart on Rest of World (ROW) - Market size and forecast 2022-2027 (USD million)
Exhibit 80: Data Table on Rest of World (ROW) - Market size and forecast 2022-2027 (USD million)
Exhibit 81: Chart on Rest of World (ROW) - Year-over-year growth 2022-2027 (%)
Exhibit 82: Data Table on Rest of World (ROW) - Year-over-year growth 2022-2027 (%)
9.7 US - Market size and forecast 2022-2027
Exhibit 83: Chart on US - Market size and forecast 2022-2027 (USD million)
Exhibit 84: Data Table on US - Market size and forecast 2022-2027 (USD million)
Exhibit 85: Chart on US - Year-over-year growth 2022-2027 (%)
Exhibit 86: Data Table on US - Year-over-year growth 2022-2027 (%)
9.8 UK - Market size and forecast 2022-2027
Exhibit 87: Chart on UK - Market size and forecast 2022-2027 (USD million)
Exhibit 88: Data Table on UK - Market size and forecast 2022-2027 (USD million)
Exhibit 89: Chart on UK - Year-over-year growth 2022-2027 (%)
Exhibit 90: Data Table on UK - Year-over-year growth 2022-2027 (%)
9.9 China - Market size and forecast 2022-2027
Exhibit 91: Chart on China - Market size and forecast 2022-2027 (USD million)
Exhibit 92: Data Table on China - Market size and forecast 2022-2027 (USD million)
Exhibit 93: Chart on China - Year-over-year growth 2022-2027 (%)
Exhibit 94: Data Table on China - Year-over-year growth 2022-2027 (%)
9.10 Germany - Market size and forecast 2022-2027
Exhibit 95: Chart on Germany - Market size and forecast 2022-2027 (USD million)
Exhibit 96: Data Table on Germany - Market size and forecast 2022-2027 (USD million)
Exhibit 97: Chart on Germany - Year-over-year growth 2022-2027 (%)
Exhibit 98: Data Table on Germany - Year-over-year growth 2022-2027 (%)
9.11 Japan - Market size and forecast 2022-2027
Exhibit 99: Chart on Japan - Market size and forecast 2022-2027 (USD million)
Exhibit 100: Data Table on Japan - Market size and forecast 2022-2027 (USD million)
Exhibit 101: Chart on Japan - Year-over-year growth 2022-2027 (%)
Exhibit 102: Data Table on Japan - Year-over-year growth 2022-2027 (%)
9.12 Market opportunity by geography
Exhibit 103: Market opportunity by geography (USD million)
Exhibit 104: Data Tables on Market opportunity by geography (USD million)
10 Drivers, Challenges, and Trends
10.1 Market drivers
10.2 Market challenges
10.3 Impact of drivers and challenges
Exhibit 105: Impact of drivers and challenges in 2022 and 2027
10.4 Market trends
11
Company Landscape
11.1 Overview
11.2 Company Landscape
Exhibit 106: Overview on Criticality of inputs and Factors of differentiation
11.3 Landscape disruption
Exhibit 107: Overview on factors of disruption
11.4 Industry risks
Exhibit 108: Impact of key risks on business
12
Company Analysis
12.1 Companies covered
Exhibit 109: Companies covered
12.2 Market positioning of companies
Exhibit 110: Matrix on company position and classification
12.3 Cook Group Inc.
Exhibit 111: Cook Group Inc. - Overview
Exhibit 112: Cook Group Inc. - Product / Service
Exhibit 113: Cook Group Inc. - Key offerings
12.4 CRITEX GmbH
Exhibit 114: CRITEX GmbH - Overview
Exhibit 115: CRITEX GmbH - Product / Service
Exhibit 116: CRITEX GmbH - Key offerings
12.5 Cryolab Ltd.
Exhibit 117: Cryolab Ltd. - Overview
Exhibit 118: Cryolab Ltd. - Product / Service
Exhibit 119: Cryolab Ltd. - Key offerings
12.6 Esco Micro Pte. Ltd.
Exhibit 120: Esco Micro Pte. Ltd. - Overview
Exhibit 121: Esco Micro Pte. Ltd. - Product / Service
Exhibit 122: Esco Micro Pte. Ltd. - Key offerings
12.7 Ferring BV
Exhibit 123: Ferring BV - Overview
Exhibit 124: Ferring BV - Product / Service
Exhibit 125: Ferring BV - Key offerings
Exhibit 126: FUJIFILM Holdings Corp. - Overview
Exhibit 127: FUJIFILM Holdings Corp. - Business segments
Exhibit 128: FUJIFILM Holdings Corp. - Key offerings
Exhibit 129: FUJIFILM Holdings Corp. - Segment focus
12.9 Genea Ltd.
Exhibit 130: Genea Ltd. - Overview
Exhibit 131: Genea Ltd. - Product / Service
Exhibit 132: Genea Ltd. - Key offerings
12.10 IMV Technologies
Exhibit 133: IMV Technologies - Overview
Exhibit 134: IMV Technologies - Product / Service
Exhibit 135: IMV Technologies - Key offerings
12.11 Instituto Bernabeu SL
Exhibit 136: Instituto Bernabeu SL - Overview
Exhibit 137: Instituto Bernabeu SL - Product / Service
Exhibit 138: Instituto Bernabeu SL - Key offerings
12.12 INVO Bioscience Inc.
Exhibit 139: INVO Bioscience Inc. - Overview
Exhibit 140: INVO Bioscience Inc. - Product / Service
Exhibit 141: INVO Bioscience Inc. - Key offerings
12.13 Merck KGaA
Exhibit 142: Merck KGaA - Overview
Exhibit 143: Merck KGaA - Business segments
Exhibit 144: Merck KGaA - Key news
Exhibit 145: Merck KGaA - Key offerings
Exhibit 146: Merck KGaA - Segment focus
12.14 Monash IVF Group Ltd.
Exhibit 147: Monash IVF Group Ltd. - Overview
Exhibit 148: Monash IVF Group Ltd. - Business segments
Exhibit 149: Monash IVF Group Ltd. - Key offerings
Exhibit 150: Monash IVF Group Ltd. - Segment focus
12.15 The Cooper Companies Inc.
Exhibit 151: The Cooper Companies Inc. - Overview
Exhibit 152: The Cooper Companies Inc. - Business segments
Exhibit 153: The Cooper Companies Inc. - Key offerings
Exhibit 154: The Cooper Companies Inc. - Segment focus
12.16 Virtus Health
Exhibit 155: Virtus Health - Overview
Exhibit 156: Virtus Health - Business segments
Exhibit 157: Virtus Health - Key news
Exhibit 158: Virtus Health - Key offerings
Exhibit 159: Virtus Health - Segment focus
12.17 Vitrolife AB
Exhibit 160: Vitrolife AB - Overview
Exhibit 161: Vitrolife AB - Business segments
Exhibit 162: Vitrolife AB - Key offerings
Exhibit 163: Vitrolife AB - Segment focus
13 Appendix
13.1 Scope of the report
13.2 Inclusions and exclusions checklist
Exhibit 164: Inclusions checklist
Exhibit 165: Exclusions checklist
13.3 Currency conversion rates for USUSD
Exhibit 166: Currency conversion rates for USUSD
13.4 Research methodology
Exhibit 167: Research methodology
Exhibit 168: Validation techniques employed for market sizing
Exhibit 169: Information sources
13.5 List of abbreviations
Exhibit 170: List of abbreviations
About US
Technavio is a leading global technology research and advisory company. Their research and analysis focuses on emerging market trends and provides actionable insights to help businesses identify market opportunities and develop effective strategies to optimize their market positions. With over 500 specialized analysts, Technavio's report library consists of more than 17,000 reports and counting, covering 800 technologies, spanning across 50 countries. Their client base consists of enterprises of all sizes, including more than 100 Fortune 500 companies. This growing client base relies on Technavio's comprehensive coverage, extensive research, and actionable market insights to identify opportunities in existing and potential markets and assess their competitive positions within changing market scenarios.
Contact
Technavio Research
Jesse Maida
Media & Marketing Executive
US: +1 844 364 1100
UK: +44 203 893 3200
Email: [email protected]
Website: www.technavio.com
SOURCE Technavio
For more details,please visit the original website
The content of the article does not represent any opinions of Synapse and its affiliated companies. If there is any copyright infringement or error, please contact us, and we will deal with it within 24 hours.
Organizations
Indications
Targets
-Drugs
-Hot reports


Get started for free today!
Accelerate Strategic R&D decision making with Synapse, PatSnap’s AI-powered Connected Innovation Intelligence Platform Built for Life Sciences Professionals.
Start your data trial now!
Synapse data is also accessible to external entities via APIs or data packages. Leverages most recent intelligence information, enabling fullest potential.