Last update 05 May 2023
MRDB Holdings LP
Last update 05 May 2023
Overview
Related
100 Clinical Results associated with MRDB Holdings LP
Login to view more data
0 Patents (Medical) associated with MRDB Holdings LP
Login to view more data
4
News (Medical) associated with MRDB Holdings LP29 Jul 2022
DUBLIN, July 29, 2022 /PRNewswire/ -- The "Asia Pacific Healthcare Facility Management Market Size, Share & Industry Trends Analysis Report By Location, By Setting, By Service, By Construction Services Type, By Energy Services Type, By Hard Services Type, By Country and Growth Forecast, 2022-2028" report has been added to
ResearchAndMarkets.com's offering.
The China Market dominated the Asia Pacific Healthcare Facility Management Market by Country in 2021, and is expected to continue to be a dominant Market till 2028; thereby, achieving a market value of $739 million by 2028. The Japan Market is anticipated to grow at a CAGR of 6.9% during (2022-2028). Additionally, The India Market is expected to experience a CAGR of 8.2% during (2022-2028).
The Market for healthcare facility management services has been growing at a rapid pace in recent years. The healthcare sector has evolved from an absolutist focus on medical processes to a more diverse industry that places a higher priority on patient safety, utility, & wellness. As a result, healthcare facilities go above and above to make state-of-the-art rooms, beds, & storage systems, rather than simply incorporating the latest medical device or technology.
The provision of medical services, as well as the availability of add-on services like air conditioning, laundry, and nurse-call, has aided in the improvement of the healthcare sector's status. Plumbing and electrical repair are two of the most popular services in the healthcare management industry.
The rise in the occurrence of chronic diseases has prompted the healthcare industry to make sure that multiple services are delivered properly. Healthcare facility management services have been more often used by private healthcare facilities. The expanding Market has been aided by the increased spending capacity of private healthcare units. Market demand has been fueled by the necessity for continuous innovations in the healthcare service fabric.
Hospitals increasingly outsource non-core medical activities to professional facilities management firms. Hospitals, nursing homes, & other healthcare institutions can save money by outsourcing facilities management services & concentrating on their core competencies.
The Asia Pacific healthcare facility management Market is expanding as the healthcare industry outsources facility management services. Medical tourism's rapid rise in emerging nations like China and India offers corporations appealing investment prospects. China's health spending per capita in 2019 exceeded 20% of the OECD average, as per the Organization for Economic Cooperation & Development's (OECD) Health at a Glance. Over the forecast period, the Chinese healthcare facility management Market is expected to rise at a fast growth rate.
Scope of the Study
Market Segments Covered in the Report:
By Location
On-site
Off-site
By Setting
Acute
Post-acute
Non-acute
By Service
Construction Services
Building Construction
Building Repair, Maintenance, Testing, & Inspection
Others
Energy Services
Energy Management
Others
Hard Services
Plumbing, Air Conditioning, & Maintenance
Fire Protection
Mechanical & Electrical Maintenance
Others
By Country
Key Market Players
3M Company
CBRE GROUP, INC.
GSH Group
Sodexo S.A.
Medxcel Facilities Management, LLC
ISS Group
Johnson Controls International PLC
ABM Industries, Inc.
Fortive Corporation (Accruent)
Key Topics Covered:
Chapter 1. Market Scope & Methodology
Chapter 2. Market Overview
Chapter 3. Strategies deployed in Healthcare Facility Management Market
Chapter 4. Asia Pacific Healthcare Facility Management Market by Location
Chapter 5. Asia Pacific Healthcare Facility Management Market by Setting
Chapter 6. Asia Pacific Healthcare Facility Management Market by Service
Chapter 7. Asia Pacific Healthcare Facility Management Market by Country
Chapter 8. Company Profiles
Companies Mentioned
3M Company
CBRE GROUP, INC.
GSH Group
Sodexo S.A.
Medxcel Facilities Management, LLC
ISS Group
Johnson Controls International PLC
ABM Industries, Inc.
Fortive Corporation (Accruent)
For more information about this report visit
Media Contact:
Research and Markets
Laura Wood, Senior Manager
[email protected]
For E.S.T Office Hours Call +1-917-300-0470
For U.S./CAN Toll Free Call +1-800-526-8630
For GMT Office Hours Call +353-1-416-8900
U.S. Fax: 646-607-1907
Fax (outside U.S.): +353-1-481-1716
Logo:
SOURCE Research and Markets
Acquisition
04 Aug 2021
Folsom, NJ, Aug. 04, 2021 (GLOBE NEWSWIRE) --
SJI Reports Second Quarter 2021 ResultsReaffirms Guidance
FOLSOM, NJ (August 4, 2021) - SJI (NYSE: SJI) today reported operating results for the second quarter and year-to-date (YTD) periods ended June 30, 2021. Highlights include:
"Our utility and non-utility businesses performed very well in the first half of the year and we remain on track to achieve our financial goals for 2021," said Mike Renna, SJI President and Chief Executive Officer. "We remain committed to delivering safe, reliable, affordable clean energy to our more than 700,000 customers and achieving our sustainability goals through critical and substantial energy infrastructure investments. My thanks, as always, to our entire team for their continued dedication to our mission and the ongoing successful achievement of our strategic goals," added Renna.
Second Quarter 2021 Results
For the three-month period ended June 30, 2021, SJI reported consolidated GAAP earnings of $(96.7) million compared to $(2.6) million in the prior year period. SJI uses the non-GAAP measure of economic earnings when discussing results. We believe this presentation provides clarity into the continuing earnings of our business. A full explanation and reconciliation of economic earnings is provided under “Explanation and Reconciliation of Non-GAAP Financial Measures” later in this report and in our 10-K for the year ending December 31, 2020. For the three-month period ended June 30, 2021, economic earnings were $2.0 million compared to $(0.9) million in the prior year period.
UTILITY
Utility entities include South Jersey Gas (SJG) and Elizabethtown Gas (ETG) operations. Second quarter 2021 GAAP/economic earnings were $3.3 million compared with $3.0 million in 2020.
South Jersey Gas
Performance. Second quarter 2021 GAAP/economic earnings were $6.3 million compared with $3.7 million in 2020. Utility margin increased $10.1 million, reflecting rate relief effective October 1, 2020, customer growth and the roll-in of investments from infrastructure replacement programs. We define utility margin, a non-GAAP measure, as natural gas revenues plus depreciation and amortization expenses, less natural gas costs, regulatory rider expenses and related volumetric and revenue-based energy taxes. Total expenses increased $7.5 million, primarily reflecting higher interest and depreciation expenses.
Customer Growth. SJG added approximately 7,300 new customers over the last 12 months and now serves approximately 408,000 customers. SJG’s 1.5% customer growth rate compares favorably to the peer average and remains driven by gas conversions from alternate fuels such as oil and propane, and new construction.
Infrastructure Modernization. Through infrastructure replacement programs, SJG enhances the safety and reliability of our system while earning our authorized utility return on approved investments in a timely manner.
Energy Efficiency. Through energy efficiency programs, SJG advances New Jersey’s clean energy goals in a manner that will benefit customers, the environment and the State’s green economy while recovering our investments in a timely manner. SJG's energy efficiency program, as approved by the BPU in April 2021, authorizes investment of $133.2 million from July 1, 2021 to June 30, 2024. Our anticipated annual investment of approximately $45 million from July 2021 to June 2022 is expected to be recovered beginning in October 2022.
Redundancy. SJG has submitted an engineering and route proposal to the BPU for approval to construct needed system upgrades in support of a planned 2.0+ Bcf liquefied natural gas (LNG) facility. Discussions with the BPU surrounding this important project continue to progress, with resolution expected before year end. We also continue to explore system alternatives that will allow for a secondary supply of gas needed to create reliability and resiliency for approximately 140,000 customers in Atlantic and Cape May counties.
Elizabethtown Gas
Performance. Second quarter 2021 GAAP/economic earnings were $(3.0) million compared with $(0.8) million in 2020. Utility margin, as previously defined, remained consistent compared to the year ago period, primarily reflecting customer growth and the roll-in of investments from infrastructure replacement programs that was offset by true-ups for sales tax and regulatory programs. Total expenses increased $2.2 million, primarily reflecting higher operating and depreciation expenses.
Customer Growth. ETG added approximately 4,100 new customers over the last 12 months and now serves approximately 303,000 customers. ETG’s 1.3% customer growth rate has increased from its historic 0.9% rate, driven by increases in gas conversions from alternate fuels such as oil and propane, and new construction.
Infrastructure Modernization. ETG's Infrastructure Investment Plan (IIP) authorizes investment of $300 million from 2019-2024 for important infrastructure upgrades including the replacement of up to 250 miles of cast iron and bare steel mains. Our annual investment of approximately $60 million from July 2020 to June 2021 is expected to be rolled into rates on October 1, 2021.
Energy Efficiency. ETG's energy efficiency program, as approved by the BPU in April 2021, authorizes investment of $74.0 million from July 1, 2021 to June 30, 2024. Our anticipated annual investment of approximately $25 million from July 2021 to June 2022 is expected to be recovered beginning in October 2022.
NON-UTILITY
Non-utility entities include Energy Management, Energy Production and Midstream. Second quarter 2021 GAAP earnings were $(90.7) million compared with $3.9 million in 2020. Second quarter 2021 economic earnings were $8.1 million compared with $5.0 million in 2020.
Energy Management
Performance. Energy Management includes Wholesale Services (Fuel Management/Marketing) and Retail Services (Account Services/Energy Consulting). Second quarter 2021 GAAP earnings were $(4.1) million compared with $5.4 million in 2020. Second quarter 2021 economic earnings were $7.0 million compared with $6.3 million in 2020.
Energy Production
Performance. Energy Production primarily includes renewable (fuel cell/solar) and decarbonization (REV/RNG development) investments. Second quarter 2021 GAAP earnings were $(0.4) million compared with $(2.4) million in 2020. Second quarter 2021 economic earnings were $(0.2) million compared with $(2.2) million in 2020.
Midstream
Performance. Midstream includes SJI's 20% equity interest in the PennEast Pipeline. Second quarter 2021 GAAP earnings were $(86.1) million compared with $0.9 million in 2020. Second quarter 2021 economic earnings were $1.2 million compared with $0.9 million in 2020, reflecting Allowance for Funds Used During Construction related to the project.
Update. Work continues with state and federal agencies to obtain the required permits to begin construction of the PennEast Pipeline. Despite the favorable outcome from the Supreme Court, PennEast continues to experience regulatory and legal challenges resulting in continued delays preventing the commencement of construction and commercial operation of the project. As a result, the Company evaluated its investment in PennEast and recorded an other-than-temporary impairment charge of $87.4 million in the condensed consolidated statements of income for the three and six months ended June 30, 2021. This action does not change our belief that PennEast is an important and needed project to serve constrained markets in the region, and that it should be built. Natural gas continues to play a critical role in meeting the energy needs of the United States, and the northeast in particular, and will be critical to ensure that energy remains affordable and reliable as we transition our supplies to lower-carbon sources.
OTHER
Performance. Other entity includes interest on debt, including debt associated with past acquisitions. Second quarter 2021 GAAP earnings were $(9.3) million compared with $(9.5) million in 2020. Second quarter 2021 economic earnings were $(9.3) million compared with $(8.8) million in 2020, reflecting an increase in outstanding debt partially offset by debt repayments and refinancing.
Six Months 2021 Results
For the six-month year-to-date (YTD) period ended June 30, 2021, SJI reported consolidated GAAP earnings of $32.1 million compared to $98.5 million in the prior year period.
For the six-month period YTD period ended June 30, 2021, economic earnings were $130.9 million compared to $106.0 million in the prior year period.
UTILITY
2021 YTD GAAP earnings were $124.9 million compared with $110.7 million in 2020. 2021 YTD economic earnings were $124.9 million compared with $111.9 million in 2020.
NON-UTILITY
2021 YTD GAAP earnings were $(74.4) million compared with $9.7 million in 2020. 2021 YTD economic earnings were $24.1 million compared with $11.3 million in 2020.
OTHER
2021 YTD GAAP earnings were $(18.4) million compared with $(21.9) million in 2020, reflecting the aforementioned impairment. 2021 YTD economic earnings were $(18.2) million compared with $(17.3) million in 2020, reflecting an increase in outstanding debt partially offset by debt repayments and refinancing.
Capital Expenditures and Cash Flow
For the six months ended June 30, 2021:
Balance Sheet
Dividends
On August 4, SJI’s board of directors declared its regular dividend of $0.3025 per share for the third quarter of 2021. The dividend is payable October 4, 2021 to shareholders of record at the close of business on September 10, 2021. This is SJI's 70th consecutive year of paying dividends, reflecting the company's commitment to a consistent, sustainable dividend.
Guidance and Outlook
Based on solid operational performance through the first half of the year, we are reaffirming our expectation for 2021 economic earnings of $1.55 to $1.65 per diluted share.
Our long-term economic earnings per share growth target remains 5 to 8 percent, with significant step ups in 2023 and 2025, driven by timing associated with utility rate cases and clean energy investments. Our long-term targets are based on expected annual rate base growth of approximately 10 percent, driven by above average customer growth, a long runway for infrastructure modernization, and clean energy and decarbonization investment.
We affirm our five-year capital expenditures outlook through 2025 of approximately $3.5 billion and our expected 2021 investment of $740 to 780 million, with $490 to 510 million for Utility investment and $250 to $270 million for Non-Utility investment primarily focused on decarbonization and renewables.
Conference Call & Webcast
SJI will host a conference call and webcast on Thursday, August 5 to discuss second quarter 2021 financial results. To access the call, please dial the applicable number approximately 5-10 minutes prior to the start time. The call will also be webcast in a listen-only format for the media and general public. The webcast can be accessed at under Events & Presentations.
Date/Time: Thursday, August 5, 11:00 a.m. ET
Dial-In: Toll Free: 866-652-5200; Toll: 412-317-6060
About SJI
SJI (NYSE: SJI), an energy services holding company based in Folsom, NJ, delivers energy services to its customers through three primary subsidiaries. SJI Utilities, SJI’s regulated natural gas utility business, delivers safe, reliable, affordable natural gas to approximately 700,000 South Jersey Gas and Elizabethtown Gas customers in New Jersey. SJI’s non-utility businesses within South Jersey Energy Solutions promote efficiency, clean technology and renewable energy by providing customized wholesale commodity marketing and fuel management services; and developing, owning and operating on-site energy production facilities. SJI Midstream houses the company’s interest in the PennEast Pipeline Project. Visit sjindustries.com for more information about SJI and its subsidiaries.
Forward-Looking Statements and Risk Factors
This news release, including information incorporated by reference, contains forward-looking statements within the meaning of the U.S. Private Securities Litigation Reform Act of 1995. All statements other than statements of historical fact, including statements regarding guidance, industry prospects or future results of operations or financial position, expected sources of incremental margin, strategy, financing needs, future capital expenditures and the outcome or effect of ongoing litigation, are forward-looking. This Quarterly Report uses words such as "anticipate," "believe," "expect," "estimate," "forecast," "goal," "intend," "objective," "plan," "project," "seek," "strategy," "target," "will" and similar expressions to identify forward-looking statements. These forward-looking statements are based on the beliefs and assumptions of management at the time that these statements were prepared and are inherently uncertain. Forward-looking statements are subject to risks and uncertainties that could cause actual results to differ materially from those expressed or implied in the forward-looking statements. These risks and uncertainties include, but are not limited to, general economic conditions on an international, national, state and local level; weather conditions in SJI’s marketing areas; changes in commodity costs; changes in the availability of natural gas; “non-routine” or “extraordinary” disruptions in SJI’s distribution system; cybersecurity incidents and related disruptions; regulatory, legislative and court decisions; competition; the availability and cost of capital; costs and effects of legal proceedings and environmental liabilities; the failure of customers, suppliers or business partners to fulfill their contractual obligations; changes in business strategies; and public health crises and epidemics or pandemics, such as a novel coronavirus (COVID-19). These risks and uncertainties, as well as other risks and uncertainties that could cause our actual results to differ materially from those expressed in the forward-looking statements, are described in greater detail under the heading “Item 1A. Risk Factors” in this Quarterly Report, SJI’s and SJG's Annual Report on Form 10-K for the year ended December 31, 2020 and in any other SEC filings made by SJI or SJG during 2020 and 2021 and prior to the filing of this earnings release. Also refer to the additional risk factor described below:
Explanation of Non-GAAP Financial Measures
Management uses the non-GAAP financial measures of Economic Earnings and Economic Earnings per share when evaluating its results of operations. These non-GAAP financial measures should not be considered as an alternative to GAAP measures, such as net income, operating income, earnings per share from continuing operations or any other GAAP measure of financial performance. We define Economic Earnings as: Income from Continuing Operations, (i) less the change in unrealized gains and plus the change in unrealized losses on non-utility derivative transactions; (ii) less income and plus losses attributable to noncontrolling interest; and (iii) less the impact of transactions, contractual arrangements or other events where management believes period to period comparisons of SJI's operations could be difficult or potentially confusing. With respect to part (iii) of the definition of Economic Earnings, items excluded from Economic Earnings for the three and six months ended June 30, 2021 and 2020, are described in (A)-(E) in the table below. Economic Earnings is a significant financial measure used by our management to indicate the amount and timing of income from continuing operations that we expect to earn after taking into account the impact of derivative instruments on the related transactions, as well as the impact of contractual arrangements and other events that management believes make period to period comparisons of SJI's operations difficult or potentially confusing. Management uses Economic Earnings to manage its business and to determine such items as incentive/compensation arrangements and allocation of resources. Specifically regarding derivatives, we believe that this financial measure indicates to investors the profitability of the entire derivative-related transaction and not just the portion that is subject to mark-to-market valuation under GAAP. We believe that considering only the change in market value on the derivative side of the transaction can produce a false sense as to the ultimate profitability of the total transaction as no change in value is reflected for the non-derivative portion of the transaction.
Reconciliation of Non-GAAP Financial Measures
The following table presents a reconciliation of our income from continuing operations and earnings per share from continuing operations to Economic Earnings and Economic Earnings per share (in thousands, except per share data):
(A) Represents an other-than-temporary impairment charge on the Company’s equity method investment in PennEast.
(B) Represents costs incurred in 2021 to finalize the transactions related to Bronx Midco, along with the final working capital payment on the sale of ELK, which was finalized during the first quarter of 2021. Also represents items recognized during the three and six months ended June 30, 2020 such as costs incurred to prepare to exit the TSA, and gains/losses recognized and costs incurred on the sale of solar assets as well as MTF/ACB.
(C) Represents severance and other employee separation costs, along with costs incurred to cease operations at three landfill gas-to-energy production facilities.
(D) The income taxes were determined using a combined average statutory tax rate.
(E) Represents additional tax adjustments, primarily including a federal deferred tax asset valuation allowance at SJI related to the impairment charge described in (A), and a one-time tax adjustment in 2020 resulting from the BPU's approval of a stipulation for SJG.
Summary of Utility Margin
The following tables summarize Utility Margin for the three months ended March 31, 2021 and 2020 for SJG and ETG (in thousands):
SJG:
ETG:
*Represents pass-through expenses for which there is a corresponding credit in operating revenues. Therefore, such recoveries have no impact on financial results.
**Utility Margin is a non-GAAP financial measure and is further defined on page 2 under SJG performance. The definition of Utility Margin is the same for SJG and ETG gas utility operations.
SOUTH JERSEY INDUSTRIES, INC. AND SUBSIDIARIESCONDENSED CONSOLIDATED STATEMENTS OF (LOSS)/INCOME (UNAUDITED)(In Thousands Except for Per Share Data)
SOUTH JERSEY INDUSTRIES, INC. AND SUBSIDIARIESCONDENSED CONSOLIDATED STATEMENTS OF CASH FLOWS (UNAUDITED)(In Thousands)
SOUTH JERSEY INDUSTRIES, INC. AND SUBSIDIARIESCONDENSED CONSOLIDATED BALANCE SHEETS (UNAUDITED)(In Thousands)
Financial StatementAcquisition
28 Mar 2021
New York, NY, March 30, 2021 (GLOBE NEWSWIRE) -- Facts and Factors have published a new research report titled “Internet of Things (IoT) in Energy Market By Offerings (Hardware, Software, and Services), By Network Technology (Cellular Network, Satellite Network, and Radio Network), and By Application (Energy Management, Power Distribution, Mobile Workforce Management, Asset, and Equipment Monitoring, Field Surveillance, and Others): Global Industry Outlook, Market Size, Business Intelligence, Consumer Preferences, Statistical Surveys, Comprehensive Analysis, Historical Developments, Current Trends, and Forecasts, 2020–2026”.
“As per the recent research study report, the global Internet of Things (IoT) in Energy Market size & share will increase from USD 16.5 Billion in 2019 and is expected to reach USD 75.3 Billion by 2026. The global Internet of Things (IoT) in Energy Market is expected to grow at a compound annual growth rate (CAGR) of 25.1% from 2019 to 2026”.
Internet of things comprises various mechanical devices, sensors, which are connected to each other through a gateway. The convergence of technologies such as embedded systems, machine learning, real-time monitoring, etc. has expanded the applicability of the internet of things (IoT) across various verticals. In recent years, a large number of electronic devices have the ability to be integrated with internet connectivity, which can be used to balance energy demand and consumption and optimizing power consumption. Moreover, the internet of things can help the user to control smart devices over cloud-based software and allows the user to control HVAC systems, changing lighting conditions, etc. Internet of things can be used in smart grid applications for gathering information and act according to insights gathered to improve the operational efficiency and efficient distribution of energy. In years to come, the rising use of automated systems for controlling electricity distribution is expected to expand the applicability of the internet of things in energy-related applications.
This specialized and expertise-oriented industry research report scrutinizes the technical and commercial business outlook of the internet of things (IoT) in energy industry. The report analyzes and declares the historical and current trends analysis of the internet of things (IoT) in energy industry and subsequently recommends the projected trends anticipated to be observed in the internet of things (IoT) in energy market during the upcoming years.
Request Your Free Sample Report of Internet of Things (IoT) in Energy Market @
(The free sample of this report is readily available on request).
Our Free Sample Report Includes:
2020 Updated Report Introduction, Overview, and In-depth industry analysis
COVID-19 Pandemic Outbreak Impact Analysis Included
190+ Pages Research Report (Inclusion of Updated Research)
Provide Chapter-wise guidance on Request
2020 Updated Regional Analysis with Graphical Representation of Size, Share & Trends
Includes Updated List of table & figures
Updated Report Includes Top Market Players with their Business Strategy, Sales Volume, and Revenue Analysis
Facts and Factors research methodology
(Note: The sample of this report is updated with COVID-19 impact analysis before delivery)
Key Questions Answered in this Report
1) What were the pre and post-business impacts of COVID-19 on the Internet of Things (IoT) in Energy Market?
2) What is the market size, share of the Internet of Things (IoT) in Energy Market?
3) Who are the top market players in the Internet of Things (IoT) in Energy Market?
4) What will be the future market of the Internet of Things (IoT) in Energy Market?
Key Insights from Primary Research
According to our primary respondents, the global internet of things in energy market is expected to grow with a CAGR of approximately 25% over the forecasted period.
Moreover, from the primary research, we gathered the insights that the North America region held a major share in the global internet of things in energy market in 2019, accounting for a market share of approximately 35% in 2019.
Our primary interviewees predicted that on the basis of application the energy management segment is set to hold a dominating share in the global internet of things in energy market in 2019. The growth in the energy management segment is due to the rising adoption of IoT based technologies for smart grid applications.
The rising awareness regarding carbon footprint and modernization of outdated smart grid infrastructure has fueled the global smart grid market, which in turn has been a key factor in driving the global IoT in energy market.
Moreover, the emergence of cognitive computing and big data analytics can help to predict failures rather than predictive maintenance. Cognitive computing also helps in risk assessment and insights generation, which is anticipated to create new revenue-generating opportunities for the global market.
Inquire more about this report before purchase @
(You may enquire a report quote OR available discount offers to our sales team before purchase.)
Impact Analysis of COVID-19 Pandemic on Businesses: Know Short Term and Long Term Impact
Most of the businesses are facing a growing litany of business-critical concerns related to the coronavirus outbreak, including supply chain disruptions, a risk of a recession, and a potential drop in consumer spending. All these scenarios will play out differently across various regions and industries, making accurate and timely market research more essential than ever.
We at Facts and Factors ( ) understand how difficult it is for you to plan, strategize, or make business decisions, and as such, we have your back to support you in these uncertain times with our research insights. Our team of consultants, analysts, and experts has developed an analytical model tool for markets that helps us to assess the impact of the virus more effectively on the industrial markets. We are further implementing these insights into our reports for a better understanding of our clients.
Request Pre and Post COVID-19 Impact Analysis on Businesses:
Top Market Players
The major players profiled in this report include IBM Corporation, Intel Corporation, Symboticware, Actility, Accenture, Cisco Systems Inc., PingThings, Flutura, Telit, Siemens, MEAZON, Northwest Analytics Inc., Altair, SAP SE, Schneider Electric SE, etc.
To know an additional revised 2020 list of market players, request a sample report:
Also Read: Renewable Energy Market, 2020-2026 Research Report
In recent years, the number of smart girds across the world has increased significantly. Governments and federal authorities are increasingly spending on developing their smart city infrastructure. Growing spending on expansion and modernization of electricity transmission and distribution infrastructure has augmented the adoption of IoT based technologies for smart grid applications, which has driven the global IoT in energy market. Moreover, energy and utility companies are inclined towards opting for smart grids and smart meters to increase operational efficiency. IoT based systems can combine smart meters with sensors to improve the efficiency of energy management. Further, the rise of cognitive computing, AI, and data analytics in IoT technology is anticipated to create new opportunities for the global IoT in energy market.
By offerings, the hardware segment held the largest share in the global IoT in energy market in 2019, accounting for a share of approximately 40% and the hardware segment is estimated to grow at a CAGR of nearly 22%. On the basis of network technology, the radio network dominated the global IoT in energy market in 2019 and held a share of approximately 70%. On the basis of network technology, the cellular network segment is anticipated to record the highest CAGR of nearly 23% over the forecasted period, owing to technological advancements in 5G IoT technology. By application, the energy management segment held a share of nearly 35% in the global IoT in energy market in 2019.
Directly Purchase a copy of the report with TOC @
The internet of things (IoT) in energy market research report delivers an acute valuation and taxonomy of the internet of things (IoT) in energy industry by practically splitting the market on the basis of different types, applications, and regions. Through the analysis of the historical and projected trends, all the segments and sub-segments were evaluated through the bottom-up approach, and different market sizes have been projected for FY 2020 to FY 2026. The regional segmentation of the internet of things (IoT) in energy industry includes the complete classification of all the major continents including North America, Latin America, Europe, Asia Pacific, and the Middle East & Africa. Further, country-wise data for the internet of things (IoT) in energy industry is provided for the leading economies of the world.
The internet of things (IoT) in Energy market is segmented based on offerings, network technology, and applications. On the basis of offerings segmentation, the market is classified into hardware, software, and services. By network technology, the global internet of things (IoT) in energy market is bifurcated into cellular networks, satellite networks, and radio networks. In terms of Application segmentation, the market is bifurcated into application energy management, power distribution, mobile workforce management, asset and equipment monitoring, field surveillance, and others.
Request Customized Copy of Report @
(We customize your report according to your research need. Ask our sales team for report customization.)
By region, North America held a share of approximately 35% in the global IoT in energy market in 2019. The North America market is expected to record a CAGR of nearly 20% over the projected period. Moreover, the Middle East and Africa region are expected to record the fastest growth over the forecasted period. The Middle East and Africa IoT in energy market growth are attributable to rising oil and gas exploration activities and soaring energy and utility sectors in the region.
Browse the full “Internet of Things (IoT) in Energy Market By Offerings (Hardware, Software, and Services), By Network Technology (Cellular Network, Satellite Network, and Radio Network) and By Application (Energy Management, Power Distribution, Mobile Workforce Management, Asset, and Equipment Monitoring, Field Surveillance, and Others): Global Industry Outlook, Market Size, Business Intelligence, Consumer Preferences, Statistical Surveys, Comprehensive Analysis, Historical Developments, Current Trends, and Forecasts, 2020–2026” report at
This report segments the Internet of Things (IoT) in Energy market as follows:
Global Internet of Things (IoT) in Energy Market: By Offerings Segmentation Analysis
Hardware
Software
Services
Global Internet of Things (IoT) in Energy Market: By Network Technology Segmentation Analysis
Cellular Network
Satellite Network
Radio Network
Global Internet of Things (IoT) in Energy Market: By Applications Segmentation Analysis
Energy Management
Power Distribution
Mobile Workforce Management
Asset and Equipment Monitoring
Field Surveillance
Others
Key Recommendations from Analysts
As per our analysts, the global internet of things in energy market was valued at approximately USD 15 billion in 2019, the growth in the global market is due to the rising adoption of wireless technology for energy management.
By offerings, the hardware segment held a major share in the global market in 2019, accounting for a share of 40%. Moreover, the services segment is estimated to record a CAGR of around 23% over the projected period.
The global internet of things in energy market is expected to grow to a market value of nearly USD 85 billion while recording a CAGR of approximately 22% till 2026.
By network technology, the radio network segment accounted for a share of around 70% in the global internet of things in energy market in 2019. The cellular network segment is estimated to register the highest growth over the projected period. The growth in the cellular network segment in years ahead is due to the emergence of 5G powered IoT technologies.
Related Reports:
Thermal Energy Storage Market:
Nuclear Power Plant and Equipment Market:
Waste To Energy Market:
Solar Energy Market:
Offshore Wind Energy Market:
About Facts & Factors (FnF Research):
Facts & Factors is a leading market research organization offering industry expertise and scrupulous consulting services to clients for their business development. The reports and services offered by Facts and Factors are used by prestigious academic institutions, start-ups, and companies globally to measure and understand the changing international and regional business backgrounds.
Our client’s/customer’s conviction on our solutions and services has pushed us in delivering always the best. Our advanced research solutions have helped them in appropriate decision-making and guidance for strategies to expand their business.
Follow Us LinkedIn:
Follow Us Twitter:
Contact Us:
Facts & Factors
USA: +1-347-989-3985
Email: sales@fnfresearch.com
Web:
100 Deals associated with MRDB Holdings LP
Login to view more data
100 Translational Medicine associated with MRDB Holdings LP
Login to view more data
Corporation Tree
Boost your research with our corporation tree data.
login
or

Pipeline
Pipeline Snapshot as of 04 Sep 2024
No data posted
Login to keep update
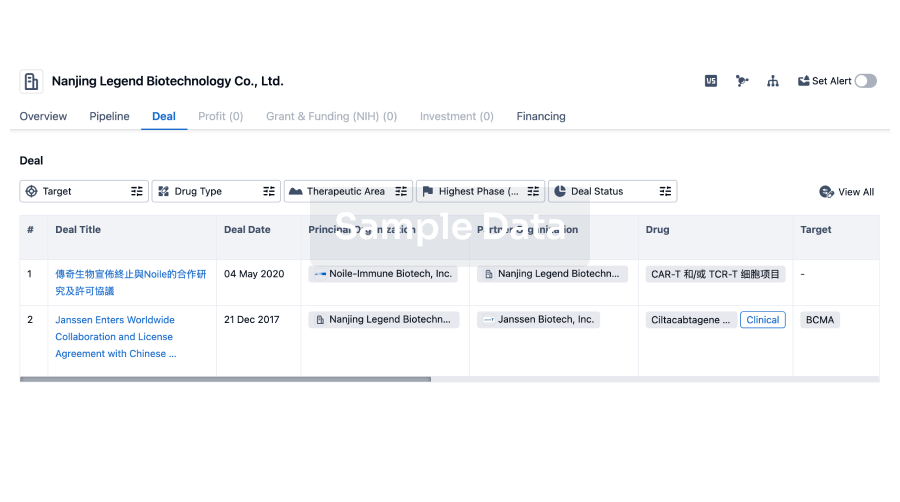
Deal
Boost your decision using our deal data.
login
or
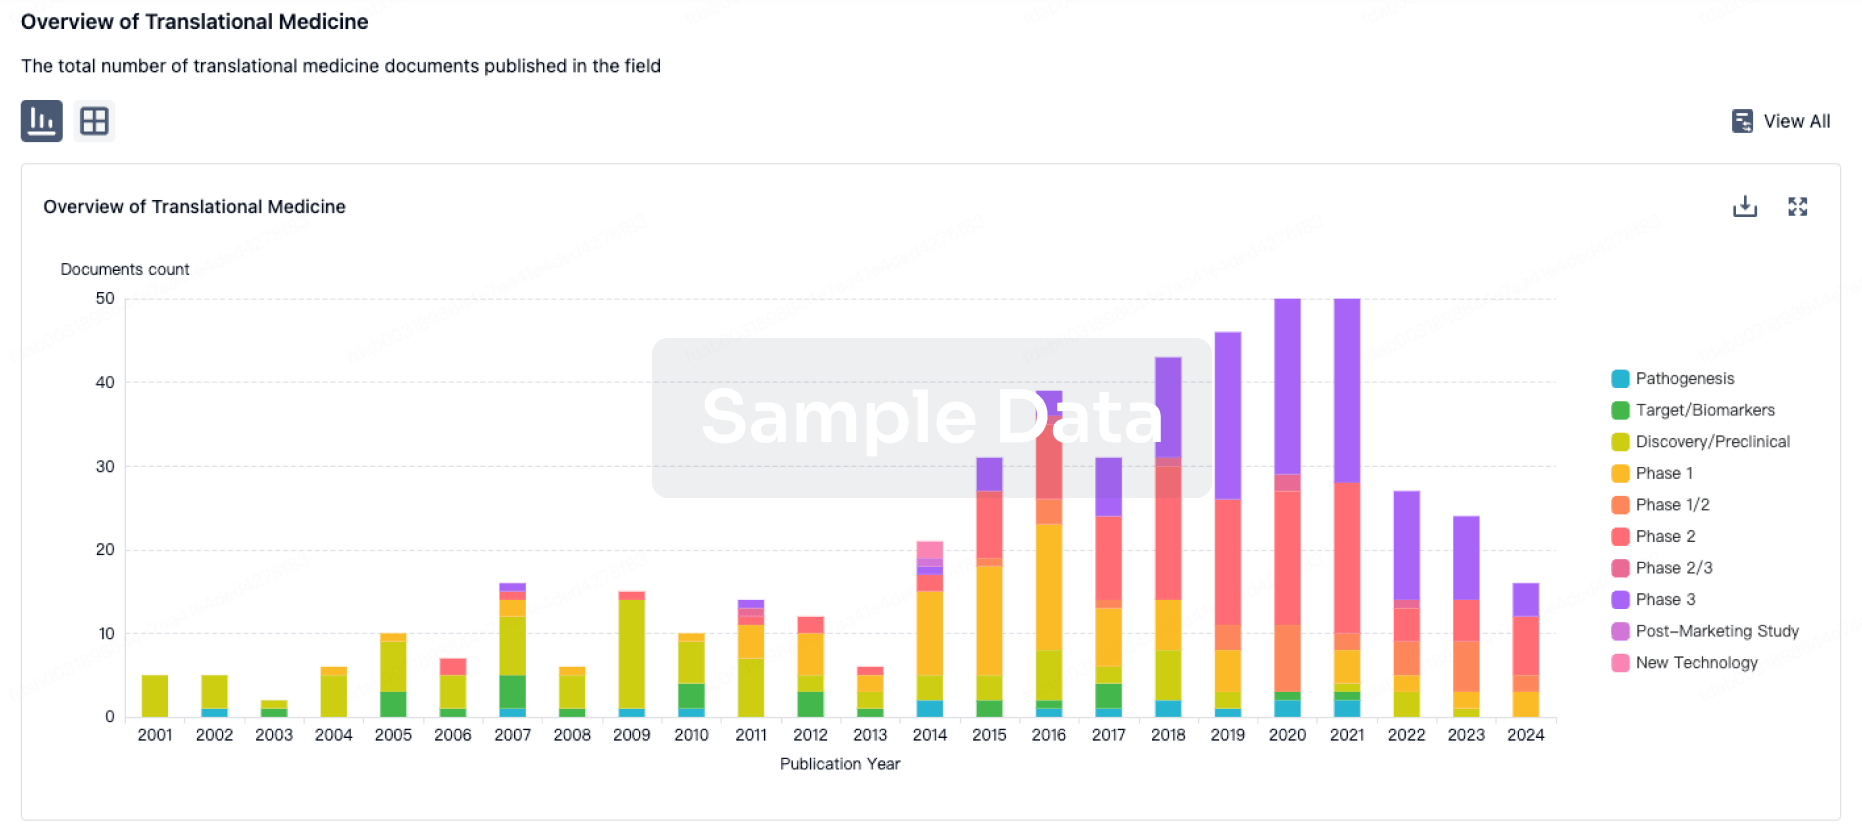
Translational Medicine
Boost your research with our translational medicine data.
login
or
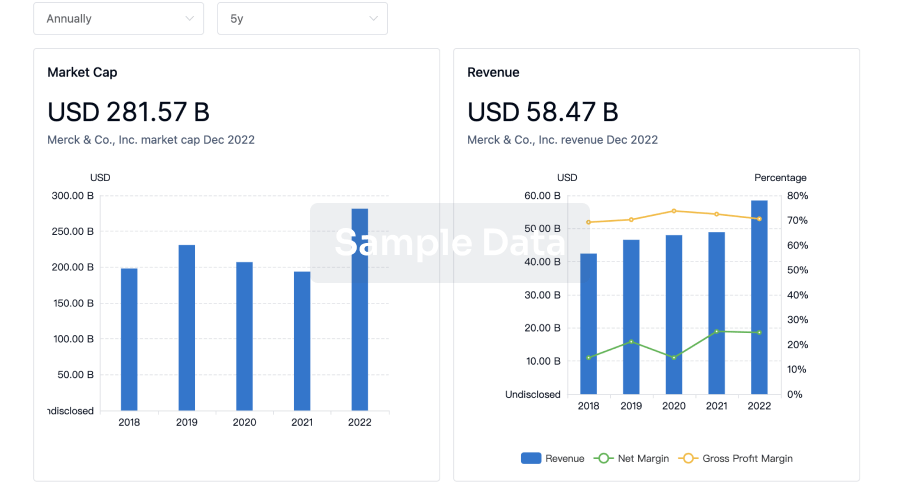
Profit
Explore the financial positions of over 360K organizations with Synapse.
login
or
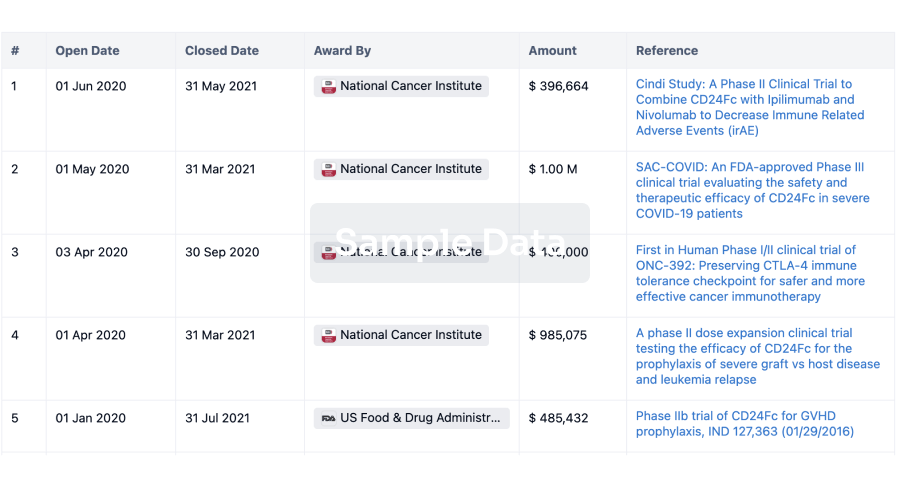
Grant & Funding(NIH)
Access more than 2 million grant and funding information to elevate your research journey.
login
or
Investment
Gain insights on the latest company investments from start-ups to established corporations.
login
or
Financing
Unearth financing trends to validate and advance investment opportunities.
login
or
Chat with Hiro
Get started for free today!
Accelerate Strategic R&D decision making with Synapse, PatSnap’s AI-powered Connected Innovation Intelligence Platform Built for Life Sciences Professionals.
Start your data trial now!
Synapse data is also accessible to external entities via APIs or data packages. Empower better decisions with the latest in pharmaceutical intelligence.
Bio
Bio Sequences Search & Analysis
Sign up for free
Chemical
Chemical Structures Search & Analysis
Sign up for free