Last update 19 Sep 2024
TTM. Co., Ltd.
Holding Company|
2003|
Seoul, South Korea
Holding Company|
2003|
Seoul, South Korea
Last update 19 Sep 2024
Overview
Related
100 Clinical Results associated with TTM. Co., Ltd.
Login to view more data
0 Patents (Medical) associated with TTM. Co., Ltd.
Login to view more data
11
News (Medical) associated with TTM. Co., Ltd.29 Sep 2022
Closure of pre-A financing round led by LAMPAM Capital
Dual internal discovery platforms of small molecule and AAV-based gene therapy targeting neurological and psychiatric disorders
SHANGHAI, Sept. 29, 2022 /PRNewswire/ -- NeuShen Therapeutics, Inc., a biotechnology company focusing on developing innovative treatments for central nervous system (CNS) disorders with dual platforms of AAV-based gene therapy and small molecule discovery, announced today the closure of ~$20 million Series pre-A financing led by LAPAM, a China based venture capital. NeuShen was founded by a group of industrial executives who have extensive global experiences in central nervous system (CNS) drug development. The new capital will be used to expand the team and catalyze in-house CNS drug discovery in both the US and China.
Continue Reading
Dr. Joan Shen, Founder and CEO of Neushen Therapeutics
"The successful completion of this fundraising is a testimony to our team's ability to accomplish CNS drug development and jump starts our discovery engine to build a pipeline with AAV-based gene therapy and small molecule programs," said Joan Shen, M.D., Ph.D., chief executive officer and founder of NeuShen. "CNS disease is an area with huge unmet needs. Our company has had a very clear goal from Day 1, which is to develop novel therapies to relieve the burdens of patients with CNS disorders. In the past few months, we have developed an achievable R&D strategy and built-up a substantial core team with experienced CNS drug hunters. Significant progress has been made in building the internal small molecule pipeline and new AAV gene therapy programs. In addition, multiple collaborations and partnerships have been discussed and established."
CNS disorders are increasingly recognized as major causes of death and disability worldwide while the diagnosis and treatments have largely lagged. Urgent measures are needed to tackle the growing challenges. "Bringing breakthroughs and learnings from other disease targets such as ophthalmology, oncology and hematology, we believe AAV-based gene therapy represents a new opportunity in the treatment of CNS disorders. My colleagues and I at Horae Gene Therapy Center are looking forward to working with Neushen to explore these treatment opportunities. The experiences of NeuShen team in neurosciences will be critical to make this happen," noted Dr. Guangping Gao, Professor, Director, Horae Gene Therapy Center, UMass Chan Medical School. The collaborations between NeuShen and UMass are currently in discussion, which will include multiple projects in CNS gene therapy.
"We are very excited to partner with NeuShen from the beginning. Lapam Capital has a strong commitment to healthcare, and we believe the CNS therapeutic area will attract more investment, considering the huge unmet needs and scientific advancements in the field. We highly value Dr. Joan Shen and her management team for their expertise. Lampam Capital is confident with NeuShen's ability to be a top player in developing innovative therapies for CNS diseases," said Mr. Zhihua Yu, Managing Director of Lapam Capital.
"Dr. Shen has assembled a pre-eminent group of scientists, clinicians and drug developers to build a global biotech developing novel medicines for unmet needs in CNS therapeutic areas. TTM Capital are excited to support Neushen to build its multi-modality pipelines to help patients worldwide," said Ms. Lilly Zhang, founding and managing partner at TTM Capital.
About NeuShen Therapeutics
NeuShen Therapeutics is a biotechnology company focusing on innovative drug research and development to address CNS disorders, applying dual research platforms, including AAV-based gene therapy and small molecule discovery. With operations both in Shanghai, China and Boston, MA, NeuShen has a world-class team and is honored to be advised by an outstanding Board of Directors and Scientific Advisory Board.
About Lapam Capital
Headquartered in Beijing, Lapam Capital is a leading healthcare venture capital firm in China. Lapam is currently managing five RMB funds and one USD fund, with more than 10 billion RMB under management. Lapam Capital focuses on investments in early to middle stage fast-growing companies that have innovative pharmaceuticals and medical devices. It has invested in about 60 biopharmaceutical companies and 10 medical device companies to date, including Betta Pharma, RemeGen Co. Ltd., Clover Biopharmaceuticals, Yahong Meditech, Stemirna Therapeutics, Binhui Biotech, ImmuneOnco Biopharmaceuticals, Biostar Pharmaceuticals, Aibo Medical Robot Co. Ltd. and many other companies with great potential. Lapam Capital has a professional investment team with more than 20 years' international and domestic biopharmaceutical industry R&D and management experience and can provide comprehensive value-added supports for the invested companies.
About TTM Capital
TTM Capital is an investment firm that specializes in China and worldwide healthcare industry. We focus on early and growth stage companies including pharmaceutical, biotech and medical technology sub-sectors.
TTM Capital's team consists of experienced global vision investment professionals with extensive industry experience, who work together to achieve superior and consistent returns for the firm's investors. We are committed to accumulating industry experience over time, with the aim to develop an ecosystem of expertise to create transformative healthcare businesses.
SOURCE NeuShen Therapeutics

Gene TherapyInnovative DrugSmall molecular drugCollaborate
04 Aug 2022
Q1 total revenues of $90.6 million, up 25% year-over-year
Q1 operating cash flow of $44.8 million, up 35% year-over-year
Q1 free cash flow of $42.6 million, up 32% year-over-year
SAN FRANCISCO, Aug. 4, 2022 /PRNewswire/ -- Doximity, Inc. (NYSE: DOCS), the leading digital platform for U.S. medical professionals, today announced results for the fiscal 2023 first quarter ended June 30, 2022.
"We're pleased that a record number of physicians, NPs, and PAs used our Doximity Dialer over 200,000 times per workday last quarter to reach and provide more convenient care for their patients," said Jeff Tangney, co-founder and CEO at Doximity. "We believe this shows that the 'new normal' has set in with our users as they adopt a more mobile, hybrid schedule."
Doximity Appoints Phoebe Yang to its Board of Directors and Launches ESG Site: More information can be found in our press releases at .
Fiscal 2023 First Quarter Financial Highlights
All comparisons, unless otherwise noted, are to the three months ended June 30, 2021.
Revenue: Revenue of $90.6 million, versus $72.7 million, an increase of 25% year-over-year.
Net income and non-GAAP net income: Net income of $22.4 million, versus $26.3 million, representing a margin of 25%, versus 36%. Non-GAAP net income of $30.8 million, versus $30.6 million, representing a margin of 34%, versus 42%.
Adjusted EBITDA: Adjusted EBITDA of $33.5 million, versus $31.2 million, an increase of 8% year-over-year, representing adjusted EBITDA margins of 37%, versus 43%.
Net income per share and non-GAAP net income per share: Diluted net income per share was $0.10, versus $0.09, while non-GAAP diluted net income per share was $0.14, versus $0.11.
Operating cash flow and free cash flow: Operating cash flow of $44.8 million, versus $33.2 million, and free cash flow of $42.6 million, versus $32.4 million.
Financial Outlook
Doximity is providing guidance for its fiscal second quarter ending September 30, 2022 as follows:
Revenue between $99.5 million and $100.5 million.
Adjusted EBITDA between $40.0 million and $41.0 million.
Doximity is revising its guidance for its fiscal year ending March 31, 2023 as follows:
Revenue between $424.0 million and $432.0 million.
Adjusted EBITDA between $178.0 million and $186.0 million.
Conference Call Information
Doximity will host a webcast today at 2:00 p.m. Pacific Time (5:00 p.m. Eastern Time) to discuss these financial results. To listen to a live audio webcast, please visit the Company's Investor Relations page at . The archived webcast will be available on the Company's Investor Relations page shortly after the call.
About Doximity
Founded in 2010, Doximity is the leading digital platform for U.S medical professionals. The company's network members include over 80% of U.S. physicians across all specialties and practice areas. Doximity provides its verified clinical membership with digital tools built for medicine, enabling them to collaborate with colleagues, stay up to date with the latest medical news and research, manage their careers and on-call schedules, and conduct virtual patient visits. Doximity's mission is to help doctors be more productive so they can provide better care for their patients. For more information, please visit .
Forward-Looking Statements
Statements we make in this press release may include statements which are not historical facts and are considered forward-looking within the meaning of Section 27A of the Securities Act and Section 21E of the Securities Exchange Act, which are usually identified by the use of words such as "anticipates," "believes," "estimates," "expects," "intends," "may," "plans," "projects," "seeks," "should," "will," and variations of such words or similar expressions. We intend these forward-looking statements to be covered by the safe harbor provisions for forward-looking statements contained in Section 27A of the Securities Act and Section 21E of the Securities Exchange Act and are making this statement for purposes of complying with those safe harbor provisions. These forward-looking statements reflect our current views about our plans, intentions, expectations, strategies and prospects, which are based on the information currently available to us and on assumptions we have made. Although we believe that our plans, intentions, expectations, strategies and prospects as reflected in or suggested by those forward-looking statements are reasonable, we can give no assurance that the plans, intentions, expectations, or strategies will be attained or achieved. Furthermore, actual results may differ materially from those described in the forward-looking statements and will be affected by a variety of risks and factors including (i) the timing and scope of anticipated stock repurchases; (ii) the impact of the COVID-19 pandemic (including the impact to our industry or on our customers' industries, impact on general economic conditions, and government responses, restrictions, and actions related to the pandemic); (iii) our ability to retain existing members or add new members to our platform and maintain or grow their engagement with our platform; (iv) our ability to attract new customers or retain existing customers; (v) the impact of our prioritization of our members' interests; (vi) breaches in our security measures or unauthorized access to members' data; (vii) our ability to maintain or manage our growth, and other risks and factors that are beyond our control including, without limitation, those set forth in the section entitled "Risk Factors" in the Annual Report on Form 10-K that was filed with the SEC on May 27, 2022. Additional information will be provided in our Quarterly Report on Form 10-Q for the quarterly period ended June 30, 2022. Moreover, we operate in a very competitive and rapidly changing environment. New risks and uncertainties emerge from time to time, and it is not possible for us to predict all risks and uncertainties that could cause actual results to differ materially from those contained in our forward-looking statements. The forward-looking statements made in this press release relate only to management's beliefs and assumptions as of this date. We assume no obligation to update publicly any forward-looking statements, whether as a result of new information, future events or otherwise, except as required by law.
Investor Relations Contact:
Perry Gold
[email protected]
Media Contact:
Amanda Cox
[email protected]
Non-GAAP Financial Measures
To supplement our condensed consolidated financial statements, which are prepared and presented in accordance with accounting principles generally accepted in the United States ("GAAP"), the Company uses the following non-GAAP measures of financial performance:
Non-GAAP gross profit, non-GAAP gross margin, non-GAAP operating income, non-GAAP net income, non-GAAP net income margin, and non-GAAP basic and diluted net income per common share: We exclude the effect of stock-based compensation expense, amortization of acquired intangible assets, change in fair value of contingent earn-out consideration liability, and expenses associated with acquisitions from non-GAAP gross profit, non-GAAP gross margin and non-GAAP operating income. Non-GAAP net income and non-GAAP net income margin are further adjusted for estimated income tax on such adjustments. We calculate income taxes on the adjustments by applying an estimated annual effective tax rate to the adjustments. Non-GAAP basic and diluted net income per common share is non-GAAP net income attributable to common stockholders divided by the weighted average number of shares. For both basic and diluted non-GAAP net income per share, the weighted average shares we use in computing non-GAAP net income per share is equal to our GAAP weighted average shares. Non-GAAP gross margin represents non-GAAP gross profit as a percentage of revenue and non-GAAP net income margin represents non-GAAP net income as a percentage of revenue.
Adjusted EBITDA and adjusted EBITDA margin: We define adjusted EBITDA as net income before interest, income taxes, depreciation, and amortization, and as further adjusted for acquisition and other related expenses, stock-based compensation expense, change in fair value of contingent earn-out consideration liability, and other income, net. Net income margin represents net income as a percentage of revenue and adjusted EBITDA margin represents adjusted EBITDA as a percentage of revenue.
Free cash flow: We calculate free cash flow as cash flow from operating activities less purchases of property and equipment and internal-use software development costs.
We use these non-GAAP financial measures internally for financial and operational decision-making purposes and as a means to evaluate period-to-period comparisons. Non-GAAP financial measures are not meant to be considered in isolation or as a substitute for comparable GAAP financial measures and should be read only in conjunction with our condensed consolidated financial statements prepared in accordance with GAAP. Our presentation of non-GAAP financial measures may not be comparable to similar measures used by other companies. We encourage investors to carefully consider our results under GAAP, as well as our supplemental non-GAAP information and the reconciliation between these presentations, to more fully understand our business. Please see the tables included at the end of this release for the reconciliation of GAAP to non-GAAP results.
Key Business Metrics
1
Net revenue retention rate: We calculate net revenue retention rate by taking the trailing 12-month ("TTM") subscription-based revenue from our customers that had revenue in the prior TTM period and dividing that by the total subscription-based revenue for the prior TTM period. Our net revenue retention rate compares our subscription revenue from the same set of customers across comparable periods and reflects customer renewals, expansion, contraction, and churn.
Customers with trailing 12-month subscription revenue greater than $100,000: We calculate the number of customers with TTM product revenue greater than $100,000 by counting the number of customers that contributed more than $100,000 in subscription revenue in the TTM period. The number of customers with TTM subscription-based revenue of at least $100,000 is a key indicator of the scale of our business. Our customer count is subject to adjustments for acquisitions, consolidations, spin-offs, and other market activity.
1 The metrics exclude the impact of the AMiON acquisition, which closed on April 1, 2022, including customers of and subscription revenue generated from the AMiON on-call scheduling and messaging application and was immaterial to the periods presented.
Reconciliation of GAAP to Non-GAAP Financial Measures
The following tables reconcile the specific items excluded from GAAP metrics in the calculation of non-GAAP metrics for the periods shown below:
SOURCE Doximity, Inc.
Financial StatementAcquisitionCollaborate
05 Aug 2021
Imugene and Celularity have announced a partnership to develop a solid tumor treatment, the two companies announced Wednesday.
The collaboration will explore the use of Imugene’s CF33-CD19, an oncolytic virus, and Celularity’s CAR T-cell therapy CD19. Studies of in vitro and in vivo models will start this year.
Celularity’s CD19 has shown T cell growth while killing tumor cells in vivo, and scientists believe that when combined with CF33-CD19, the therapy could improve outcomes for patients with solid tumors.
“We believe the synergy between Celularity’s placental derived cells and our OnCARlytic platform has the potential to shift the cellular medicine paradigm,” Imugene CEO Leslie Chong said. “In preclinical studies Celularity’s cellular therapies have shown the ability to overcome limitations that have hindered other approaches, including increased proliferation and persistence in vivo, resistance to T-cell exhaustion and low immunogenicity, which allows for repeated dosing. These unique characteristics perfectly align with our vision for a combination treatment strategy, and we look forward to closely working together to bring this treatment strategy to the clinic and patients in need.”
Imugene licensed CD19 from Los Angeles-based cancer treatment center City of Hope. —Josh Sullivan
Former Kinnate CEO Stephen Kaldor reels in $50M for new biotech
Three years after Stephen Kaldor co-founded Kinnate Biopharma, the company hit Wall Street with a $276 million IPO. Now, Kaldor is looking to recreate that success at XinThera, a small San Diego-based biotech that just nabbed a modest $50 million to support its recruiting efforts.
The Series B round brings XinThera’s total raise to $80 million, the company said on Wednesday. Co-founder and CSO Qing Dong says the team is working on a small molecule oncology and immunology pipeline, though he didn’t offer much more detail than that in the news release.
“Steve Kaldor has assembled an exceptional group of drug developers with an ambitious vision to build a global organization working across multiple therapeutic areas,” said Carl Gordon, general partner at Orbimed, which participated in the round. Existing investors Foresite Capital and TTM Capital also chipped in.
Kaldor and Dong are joined by a third co-founder Gene Hung, who previously helped launch the biotech FronThera. — Nicole DeFeudis
China’s Berry Oncology piles on the capital with another $100m round
China-based genomics testing provider Berry Oncology on Thursday announced another round of financing, this time for about $100 million, to help boost an expansion in early cancer screening.
The firm, which is a member company of Barry Genomics, performs genetic testing of cancers in more than 600 hospitals across China. Back in 2017, Barry Oncology raised a little more than $120 million to fund its early cancer diagnosis R&D work.
Now, Berry Oncology has three centers — manufacturing, supercomputing, and R&D centers — located in Fuzhou and Beijing. This latest round of financing was led by China Merchants Capital Management Co., Ltd. — Zachary Brennan
CollaborateCell TherapySmall molecular drugIPO
100 Deals associated with TTM. Co., Ltd.
Login to view more data
100 Translational Medicine associated with TTM. Co., Ltd.
Login to view more data
Corporation Tree
Boost your research with our corporation tree data.
login
or
Pipeline
Pipeline Snapshot as of 06 Oct 2024
No data posted
Login to keep update
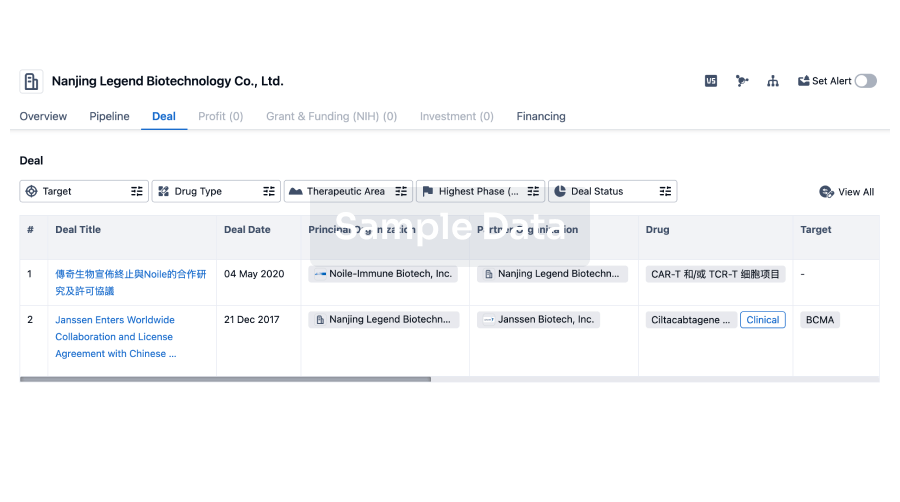
Deal
Boost your decision using our deal data.
login
or
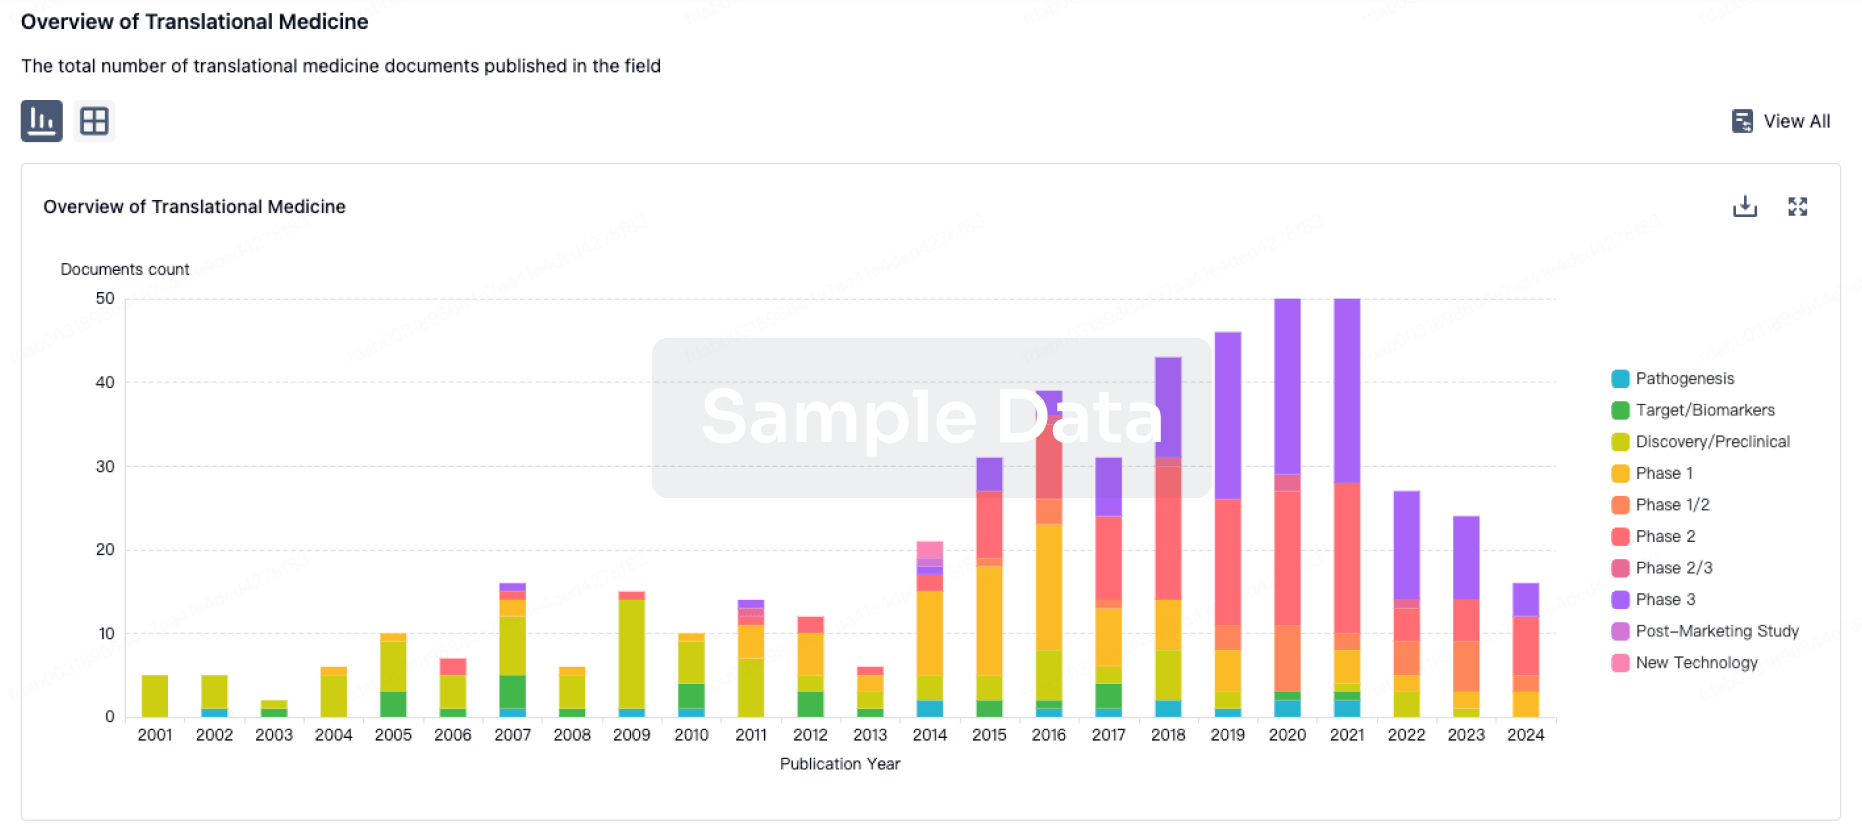
Translational Medicine
Boost your research with our translational medicine data.
login
or
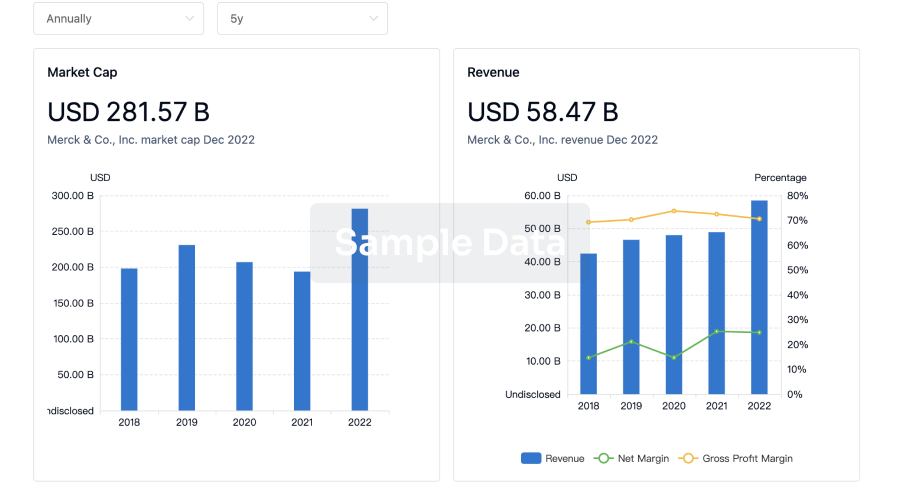
Profit
Explore the financial positions of over 360K organizations with Synapse.
login
or
Grant & Funding(NIH)
Access more than 2 million grant and funding information to elevate your research journey.
login
or
Investment
Gain insights on the latest company investments from start-ups to established corporations.
login
or
Financing
Unearth financing trends to validate and advance investment opportunities.
login
or
Chat with Hiro
Get started for free today!
Accelerate Strategic R&D decision making with Synapse, PatSnap’s AI-powered Connected Innovation Intelligence Platform Built for Life Sciences Professionals.
Start your data trial now!
Synapse data is also accessible to external entities via APIs or data packages. Empower better decisions with the latest in pharmaceutical intelligence.
Bio
Bio Sequences Search & Analysis
Sign up for free
Chemical
Chemical Structures Search & Analysis
Sign up for free