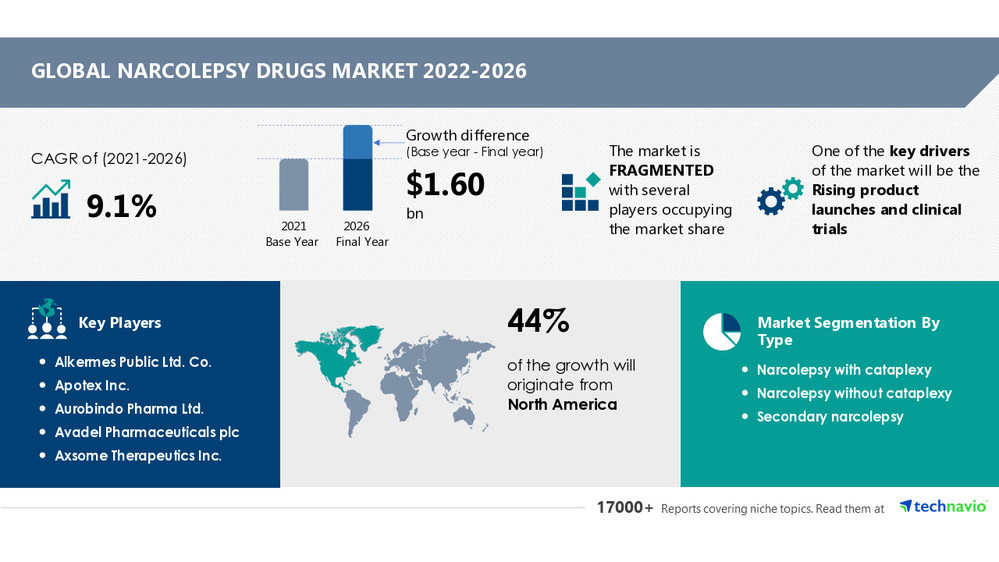
Narcolepsy Drugs Market Size to Grow by USD 1.60 billion with 44% of the Contribution from North America - Technavio
07 Sep 2022
Alkermes Public Ltd. Co., Apotex Inc. and Aurobindo Pharma Ltd. will emerge as major narcolepsy drugs market participants
NEW YORK, Sept. 7, 2022 /PRNewswire/ -- The latest market analysis report titled
Narcolepsy Drugs Market by Type and Geography - Forecast and Analysis 2022-2026 has been added to Technavio's catalog. The report predicts the market to witness an accelerating growth momentum at a CAGR of 9.1%. Technavio categorizes the global narcolepsy drugs market as a part of the
global pharmaceuticals market. Our report provides extensive information on the value chain analysis for the narcolepsy drugs market, which vendors can leverage to gain a competitive advantage during the forecast period. The data available in our value chain analysis segment can help vendors drive costs and enhance customer services during the forecast period.
Preview
Source: PRNewswire
Narcolepsy Drugs Market by Type and Geography - Forecast and Analysis 2022-2026
For more insights on the scope and value chain analysis, Read a FREE Sample Report
Key Considerations for Market Forecast:
Impact of lockdowns, supply chain disruptions, demand destruction, and change in customer behavior
Optimistic, probable, and pessimistic scenarios for all markets as the impact of pandemic unfolds
Pre- as well as post-COVID-19 market estimates
Quarterly impact analysis and updates on market estimates
Key Market Participants Analysis
Alkermes Public Ltd. Co.
The company is focused on developing innovative medicines that aim to address the unmet needs of people living with serious mental illness, addiction, and cancer. The company offers narcolepsy drugs such as ALKS 2680 tablets
The company offers narcolepsy drugs such as FT218 tablets.
Under this segment, the company develops novel therapies for the management of CNS disorders. The company offers narcolepsy drugs such as Sunosi tablets.
The company manufactures and supplies prescription-only medication throughout the world. The company offers narcolepsy drugs such as Wakix which is a histamine H3 receptor antagonist.
The company operates in a single segment involved in the identification, development, and commercialization of meaningful pharmaceutical products that address unmet medical needs. The company offers narcolepsy drugs such as Xywav tablets.
Download Sample PDF for Vendor-specific insights and their initiatives
Narcolepsy Drugs Market Segmentation Highlights
Type
Narcolepsy With Cataplexy: The narcolepsy drugs market share growth in the narcolepsy with cataplexy segment will be significant during the forecast period. The onset of narcolepsy with cataplexy is usually during the teenage and young adulthood years and persists throughout the lifetime. Pathophysiological studies have shown that the disease is caused by the early loss of neurons in the hypothalamus that produce hypocretin, a wakefulness-associated neurotransmitter, present in cerebrospinal fluid. The treatment includes stimulant drugs to suppress daytime sleepiness, antidepressants for cataplexy, and gamma-hydroxybutyrate for both symptoms. Moreover, the rising cases of narcolepsy with cataplexy will boost the market growth during the forecast period.
Narcolepsy Without Cataplexy
Secondary Narcolepsy
Geography
North America: 44% of the market's growth will originate from North America during the forecast period. The US and Canada are the key markets for the narcolepsy drugs market in North America. Market growth in this region will be slower than the growth of the market in Asia. The high per capita pharmaceutical expenditure will facilitate the narcolepsy drugs market growth in North America over the forecast period.
Europe
Asia
Rest Of World (ROW)
Download Segment-wise Insights and Regional Opportunities in this PDF Sample
Related Reports
Curing Agent Market
by Type and Geography - Forecast and Analysis 2022-2026
Quinidine Sulfate Market
by Disease Type and Geography - Forecast and Analysis 2022-2026
Table of Content
1 Executive Summary
1.1 Market overview
Exhibit 01: Executive Summary – Chart on Market Overview
Exhibit 02: Executive Summary – Data Table on Market Overview
Exhibit 03: Executive Summary – Chart on Global Market Characteristics
Exhibit 04: Executive Summary – Chart on Market by Geography
Exhibit 05: Executive Summary – Chart on Market Segmentation by Type
Exhibit 06: Executive Summary – Chart on Incremental Growth
Exhibit 07: Executive Summary – Data Table on Incremental Growth
Exhibit 08: Executive Summary – Chart on Vendor Market Positioning
2 Market Landscape
2.1 Market ecosystem
Exhibit 09: Parent market
Exhibit 10: Market Characteristics
3 Market Sizing
3.1 Market definition
Exhibit 11: Offerings of vendors included in the market definition
3.2 Market segment analysis
Exhibit 12: Market segments
3.3 Market size 2021
3.4 Market outlook: Forecast for 2021-2026
Exhibit 13: Chart on Global - Market size and forecast 2021-2026 ($ million)
Exhibit 14: Data Table on Global - Market size and forecast 2021-2026 ($ million)
Exhibit 15: Chart on Global Market: Year-over-year growth 2021-2026 (%)
Exhibit 16: Data Table on Global Market: Year-over-year growth 2021-2026 (%)
4 Five Forces Analysis
4.1 Five forces summary
Exhibit 17: Five forces analysis - Comparison between 2021 and 2026
4.2 Bargaining power of buyers
Exhibit 18: Chart on Bargaining power of buyers – Impact of key factors 2021 and 2026
4.3 Bargaining power of suppliers
Exhibit 19: Bargaining power of suppliers – Impact of key factors in 2021 and 2026
4.4 Threat of new entrants
Exhibit 20: Threat of new entrants – Impact of key factors in 2021 and 2026
4.5 Threat of substitutes
Exhibit 21: Threat of substitutes – Impact of key factors in 2021 and 2026
4.6 Threat of rivalry
Exhibit 22: Threat of rivalry – Impact of key factors in 2021 and 2026
4.7 Market condition
Exhibit 23: Chart on Market condition - Five forces 2021 and 2026
5 Market Segmentation by Type
5.1 Market segments
Exhibit 24: Chart on Type - Market share 2021-2026 (%)
Exhibit 25: Data Table on Type - Market share 2021-2026 (%)
5.2 Comparison by Type
Exhibit 26: Chart on Comparison by Type
Exhibit 27: Data Table on Comparison by Type
5.3 NarcolepsyNarcolepsy with cataplexy - Market size and forecast 2021-2026
Exhibit 28: Chart on NarcolepsyNarcolepsy with cataplexy - Market size and forecast 2021-2026 ($ million)
Exhibit 29: Data Table on Narcolepsy with cataplexy - Market size and forecast 2021-2026 ($ million)
Exhibit 30: Chart on NarcolepsyNarcolepsy with cataplexy - Year-over-year growth 2021-2026 (%)
Exhibit 31: Data Table on Narcolepsy with cataplexy - Year-over-year growth 2021-2026 (%)
5.4 NarcolepsyNarcolepsy without cataplexy - Market size and forecast 2021-2026
Exhibit 32: Chart on NarcolepsyNarcolepsy without cataplexy - Market size and forecast 2021-2026 ($ million)
Exhibit 33: Data Table on Narcolepsy without cataplexy - Market size and forecast 2021-2026 ($ million)
Exhibit 34: Chart on NarcolepsyNarcolepsy without cataplexy - Year-over-year growth 2021-2026 (%)
Exhibit 35: Data Table on Narcolepsy without cataplexy - Year-over-year growth 2021-2026 (%)
5.5 Secondary narcolepsy - Market size and forecast 2021-2026
Exhibit 36: Chart on Secondary narcolepsy - Market size and forecast 2021-2026 ($ million)
Exhibit 37: Data Table on Secondary narcolepsy - Market size and forecast 2021-2026 ($ million)
Exhibit 38: Chart on Secondary narcolepsy - Year-over-year growth 2021-2026 (%)
Exhibit 39: Data Table on Secondary narcolepsy - Year-over-year growth 2021-2026 (%)
5.6 Market opportunity by Type
Exhibit 40: Market opportunity by Type ($ million)
6 Customer Landscape
6.1 Customer landscape overview
Exhibit 41: Analysis of price sensitivity, lifecycle, customer purchase basket, adoption rates, and purchase criteria
7 Geographic Landscape
7.1 Geographic segmentation
Exhibit 42: Chart on Market share by geography 2021-2026 (%)
Exhibit 43: Data Table on Market share by geography 2021-2026 (%)
7.2 Geographic comparison
Exhibit 44: Chart on Geographic comparison
Exhibit 45: Data Table on Geographic comparison
7.3 North America - Market size and forecast 2021-2026
Exhibit 46: Chart on North America - Market size and forecast 2021-2026 ($ million)
Exhibit 47: Data Table on North America - Market size and forecast 2021-2026 ($ million)
Exhibit 48: Chart on North America - Year-over-year growth 2021-2026 (%)
Exhibit 49: Data Table on North America - Year-over-year growth 2021-2026 (%)
7.4 Europe - Market size and forecast 2021-2026
Exhibit 50: Chart on Europe - Market size and forecast 2021-2026 ($ million)
Exhibit 51: Data Table on Europe - Market size and forecast 2021-2026 ($ million)
Exhibit 52: Chart on Europe - Year-over-year growth 2021-2026 (%)
Exhibit 53: Data Table on Europe - Year-over-year growth 2021-2026 (%)
7.5 Asia - Market size and forecast 2021-2026
Exhibit 54: Chart on Asia - Market size and forecast 2021-2026 ($ million)
Exhibit 55: Data Table on Asia - Market size and forecast 2021-2026 ($ million)
Exhibit 56: Chart on Asia - Year-over-year growth 2021-2026 (%)
Exhibit 57: Data Table on Asia - Year-over-year growth 2021-2026 (%)
7.6 Rest of World (ROW) - Market size and forecast 2021-2026
Exhibit 58: Chart on Rest of World (ROW) - Market size and forecast 2021-2026 ($ million)
Exhibit 59: Data Table on Rest of World (ROW) - Market size and forecast 2021-2026 ($ million)
Exhibit 60: Chart on Rest of World (ROW) - Year-over-year growth 2021-2026 (%)
Exhibit 61: Data Table on Rest of World (ROW) - Year-over-year growth 2021-2026 (%)
7.7 US - Market size and forecast 2021-2026
Exhibit 62: Chart on US - Market size and forecast 2021-2026 ($ million)
Exhibit 63: Data Table on US - Market size and forecast 2021-2026 ($ million)
Exhibit 64: Chart on US - Year-over-year growth 2021-2026 (%)
Exhibit 65: Data Table on US - Year-over-year growth 2021-2026 (%)
7.8 Germany - Market size and forecast 2021-2026
Exhibit 66: Chart on Germany - Market size and forecast 2021-2026 ($ million)
Exhibit 67: Data Table on Germany - Market size and forecast 2021-2026 ($ million)
Exhibit 68: Chart on Germany - Year-over-year growth 2021-2026 (%)
Exhibit 69: Data Table on Germany - Year-over-year growth 2021-2026 (%)
7.9 UK - Market size and forecast 2021-2026
Exhibit 70: Chart on UK - Market size and forecast 2021-2026 ($ million)
Exhibit 71: Data Table on UK - Market size and forecast 2021-2026 ($ million)
Exhibit 72: Chart on UK - Year-over-year growth 2021-2026 (%)
Exhibit 73: Data Table on UK - Year-over-year growth 2021-2026 (%)
7.10 Canada - Market size and forecast 2021-2026
Exhibit 74: Chart on Canada - Market size and forecast 2021-2026 ($ million)
Exhibit 75: Data Table on Canada - Market size and forecast 2021-2026 ($ million)
Exhibit 76: Chart on Canada - Year-over-year growth 2021-2026 (%)
Exhibit 77: Data Table on Canada - Year-over-year growth 2021-2026 (%)
7.11 France - Market size and forecast 2021-2026
Exhibit 78: Chart on France - Market size and forecast 2021-2026 ($ million)
Exhibit 79: Data Table on France - Market size and forecast 2021-2026 ($ million)
Exhibit 80: Chart on France - Year-over-year growth 2021-2026 (%)
Exhibit 81: Data Table on France - Year-over-year growth 2021-2026 (%)
7.12 Market opportunity by geography
Exhibit 82: Market opportunity by geography ($ million)
8 Drivers, Challenges, and Trends
8.1 Market drivers
8.2 Market challenges
8.3 Impact of drivers and challenges
Exhibit 83: Impact of drivers and challenges in 2021 and 2026
8.4 Market trends
9 Vendor Landscape
9.1 Overview
9.2 Vendor landscape
Exhibit 84: Overview on Criticality of inputs and Factors of differentiation
9.3 Landscape disruption
Exhibit 85: Overview on factors of disruption
9.4 Industry risks
Exhibit 86: Impact of key risks on business
10 Vendor Analysis
10.1 Vendors covered
Exhibit 87: Vendors covered
10.2 Market positioning of vendors
Exhibit 88: Matrix on vendor position and classification
Exhibit 89: Alkermes Public Ltd. Co. - Overview
Exhibit 90: Alkermes Public Ltd. Co. - Product / Service
Exhibit 91: Alkermes Public Ltd. Co. - Key news
Exhibit 92: Alkermes Public Ltd. Co. - Key offerings
Exhibit 93: Avadel Pharmaceuticals plc - Overview
Exhibit 94: Avadel Pharmaceuticals plc - Business segments
Exhibit 95: Avadel Pharmaceuticals plc - Key news
Exhibit 96: Avadel Pharmaceuticals plc - Key offerings
Exhibit 97: Avadel Pharmaceuticals plc - Segment focus
Exhibit 98: Axsome Therapeutics Inc. - Overview
Exhibit 99: Axsome Therapeutics Inc. - Product / Service
Exhibit 100: Axsome Therapeutics Inc. - Key offerings
10.6 BIOPROJET
Exhibit 101: BIOPROJET - Overview
Exhibit 102: BIOPROJET - Product / Service
Exhibit 103: BIOPROJET - Key offerings
Exhibit 104: Jazz Pharmaceuticals Plc - Overview
Exhibit 105: Jazz Pharmaceuticals Plc - Product / Service
Exhibit 106: Jazz Pharmaceuticals Plc - Key news
Exhibit 107: Jazz Pharmaceuticals Plc - Key offerings
10.8 Shionogi and Co. Ltd.
Exhibit 108: Shionogi and Co. Ltd. - Overview
Exhibit 109: Shionogi and Co. Ltd. - Product / Service
Exhibit 110: Shionogi and Co. Ltd. - Key offerings
10.9 Somacare
Exhibit 111: Somacare - Overview
Exhibit 112: Somacare - Product / Service
Exhibit 113: Somacare - Key offerings
Exhibit 114: Takeda Pharmaceutical Co. Ltd. - Overview
Exhibit 115: Takeda Pharmaceutical Co. Ltd. - Product / Service
Exhibit 116: Takeda Pharmaceutical Co. Ltd. - Key news
Exhibit 117: Takeda Pharmaceutical Co. Ltd. - Key offerings
Exhibit 118: Teva Pharmaceutical Industries Ltd. - Overview
Exhibit 119: Teva Pharmaceutical Industries Ltd. - Business segments
Exhibit 120: Teva Pharmaceutical Industries Ltd. - Key news
Exhibit 121: Teva Pharmaceutical Industries Ltd. - Key offerings
Exhibit 122: Teva Pharmaceutical Industries Ltd. - Segment focus
10.12 XWPharma Ltd.
Exhibit 123: XWPharma Ltd. - Overview
Exhibit 124: XWPharma Ltd. - Product / Service
Exhibit 125: XWPharma Ltd. - Key offerings
11.1 Scope of the report
11.2 Inclusions and exclusions checklist
Exhibit 126: Inclusions checklist
Exhibit 127: Exclusions checklist
11.3 Currency conversion rates for US$
Exhibit 128: Currency conversion rates for US$
11.4 Research methodology
Exhibit 129: Research methodology
Exhibit 130: Validation techniques employed for market sizing
Exhibit 131: Information sources
11.5 List of abbreviations
Exhibit 132: List of abbreviations
About Us
Technavio is a leading global technology research and advisory company. Their research and analysis focus on emerging market trends and provide actionable insights to help businesses identify market opportunities and develop effective strategies to optimize their market positions. With over 500 specialized analysts, Technavio's report library consists of more than 17,000 reports and counting, covering 800 technologies, spanning 50 countries. Their client base consists of enterprises of all sizes, including more than 100 Fortune 500 companies. This growing client base relies on Technavio's comprehensive coverage, extensive research, and actionable market insights to identify opportunities in existing and potential markets and assess their competitive positions within changing market scenarios.
Contact
Technavio Research
Jesse Maida
US: +1 844 364 1100
UK: +44 203 893 3200
Email: [email protected]
Website: www.technavio.com/
SOURCE Technavio
For more details,please visit the original website
The content of the article does not represent any opinions of Synapse and its affiliated companies. If there is any copyright infringement or error, please contact us, and we will deal with it within 24 hours.
Indications
Targets
-Hot reports


Get started for free today!
Accelerate Strategic R&D decision making with Synapse, PatSnap’s AI-powered Connected Innovation Intelligence Platform Built for Life Sciences Professionals.
Start your data trial now!
Synapse data is also accessible to external entities via APIs or data packages. Leverages most recent intelligence information, enabling fullest potential.