Erythropoietin Stimulating Agents Market to register USD 4.74 Bn growth - Technavio
14 Sep 2022
NEW YORK, Sept. 14, 2022 /PRNewswire/ -- Technavio has been monitoring the
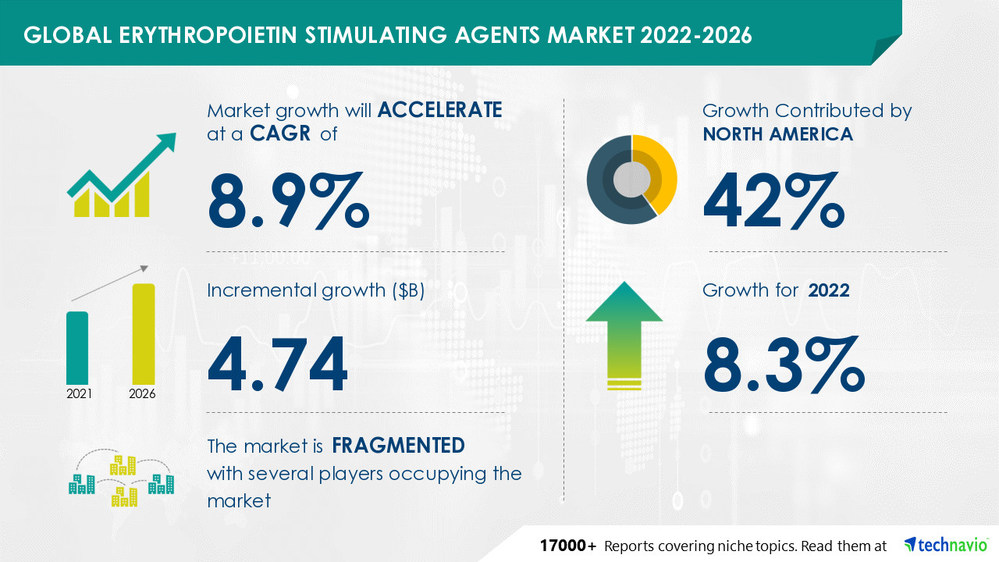
Erythropoietin Stimulating Agents Market, operating under the health care industry. The report estimates the market to register an incremental growth of
USD 4.74 billion, at a
CAGR of 8.9% during the forecast period. The report offers an up-to-date analysis of the current market scenario, the latest trends and drivers, and the overall market environment.
Request the Latest Free sample report
.
Preview
Source: PRNewswire
Technavio has announced its latest market research report titled Erythropoietin Stimulating Agents Market by Type and Geography - Forecast and Analysis 2022-2026
The market is fragmented, and the degree of fragmentation will accelerate during the forecast period. Competitors have to focus on differentiating their product offerings with unique value propositions to strengthen their foothold in the market.
Market vendors also have to leverage the existing growth prospects in the fast-growing segments, while maintaining their positions in the slow-growing segments. 3SBio Inc., Akebia Therapeutics Inc., Amgen Inc., Biocon Ltd., Biosidus SA, Dr. Reddys Laboratories Ltd., F. Hoffmann La Roche Ltd., LG Chem Ltd., Pieris Pharmaceuticals Inc., Reliance Industries Ltd., Thermo Fisher Scientific Inc., and Zydus Lifesciences Ltd. are among some of the major market participants.
The presence of a large pool of CKD patients has been instrumental in driving the growth of the market. However, stringent government regulations might hamper the market growth.
Buy Sample Report.
Erythropoietin Stimulating Agents Market Segmentation
Based on geographic segmentation,
42% of the market's originated from
North America during the forecast period. In addition, the Epoetin Alfa category led the growth under the type segment. This report provides an accurate prediction of the contribution of all the segments to the growth of the superfood powders market size.
Type
Others
Geography
North America
Europe
Asia
Rest Of World (ROW)
Erythropoietin Stimulating Agents Market Scope
Technavio presents a detailed picture of the market by the way of study, synthesis, and summation of data from multiple sources. The erythropoietin stimulating agents market report covers the following areas:
Erythropoietin Stimulating Agents Market Size
Erythropoietin Stimulating Agents Market Trends
Erythropoietin Stimulating Agents Market Industry Analysis
This study identifies the growing number of CKD dialysis centers in developing economies as one of the prime reasons driving the Erythropoietin Stimulating Agents Market growth during the next few years.
Download Free Sample Report.
Erythropoietin Stimulating Agents Market Key Highlights
CAGR of the market during the forecast period
Detailed information on factors that will assist erythropoietin stimulating agents market growth during the next five years
Estimation of the erythropoietin stimulating agents market size and its contribution to the parent market
Predictions on upcoming trends and changes in consumer behavior
The growth of the erythropoietin stimulating agents market
Analysis of the market's competitive landscape and detailed information on vendors
Comprehensive details of factors that will challenge the growth of the erythropoietin stimulating agents market, vendors
Related Reports
Stem Cell Umbilical Cord Blood (UCB) Market
by End-user and Geography - Forecast and Analysis 2022-2026: The stem cell umbilical cord blood (UCB) market share is expected to increase by $ 1.47 bn from 2021 to 2026, and the market's growth momentum will accelerate at a CAGR of 16.87%.
Pregabalin Market
by Application and Geography - Forecast and Analysis 2022-2026: The pregabalin market share is expected to increase by USD 153.03 million from 2021 to 2026, and the market's growth momentum will accelerate at a CAGR of 3.74%.
Browse for Technavio "
" Research Reports
Table of Contents:
1 Executive Summary
1.1 Market overview
Exhibit 01: Executive Summary – Chart on Market Overview
Exhibit 02: Executive Summary – Data Table on Market Overview
Exhibit 03: Executive Summary – Chart on Global Market Characteristics
Exhibit 04: Executive Summary – Chart on Market by Geography
Exhibit 05: Executive Summary – Chart on Market Segmentation by Type
Exhibit 06: Executive Summary – Chart on Incremental Growth
Exhibit 07: Executive Summary – Data Table on Incremental Growth
Exhibit 08: Executive Summary – Chart on Vendor Market Positioning
2 Market Landscape
2.1 Market ecosystem
Exhibit 09: Parent market
Exhibit 10: Market Characteristics
3 Market Sizing
3.1 Market definition
Exhibit 11: Offerings of vendors included in the market definition
3.2 Market segment analysis
Exhibit 12: Market segments
3.3 Market size 2021
3.4 Market outlook: Forecast for 2021-2026
Exhibit 13: Chart on Global - Market size and forecast 2021-2026 ($ million)
Exhibit 14: Data Table on Global - Market size and forecast 2021-2026 ($ million)
Exhibit 15: Chart on Global Market: Year-over-year growth 2021-2026 (%)
Exhibit 16: Data Table on Global Market: Year-over-year growth 2021-2026 (%)
4 Five Forces Analysis
4.1 Five forces summary
Exhibit 17: Five forces analysis - Comparison between 2021 and 2026
4.2 Bargaining power of buyers
Exhibit 18: Chart on Bargaining power of buyers – Impact of key factors 2021 and 2026
4.3 Bargaining power of suppliers
Exhibit 19: Bargaining power of suppliers – Impact of key factors in 2021 and 2026
4.4 Threat of new entrants
Exhibit 20: Threat of new entrants – Impact of key factors in 2021 and 2026
4.5 Threat of substitutes
Exhibit 21: Threat of substitutes – Impact of key factors in 2021 and 2026
4.6 Threat of rivalry
Exhibit 22: Threat of rivalry – Impact of key factors in 2021 and 2026
4.7 Market condition
Exhibit 23: Chart on Market condition - Five forces 2021 and 2026
5 Market Segmentation by Type
5.1 Market segments
Exhibit 24: Chart on Type - Market share 2021-2026 (%)
Exhibit 25: Data Table on Type - Market share 2021-2026 (%)
5.2 Comparison by Type
Exhibit 26: Chart on Comparison by Type
Exhibit 27: Data Table on Comparison by Type
5.3 Epoetin alfa - Market size and forecast 2021-2026
Exhibit 28: Chart on Epoetin alfa - Market size and forecast 2021-2026 ($ million)
Exhibit 29: Data Table on Epoetin alfa - Market size and forecast 2021-2026 ($ million)
Exhibit 30: Chart on Epoetin alfa - Year-over-year growth 2021-2026 (%)
Exhibit 31: Data Table on Epoetin alfa - Year-over-year growth 2021-2026 (%)
5.4 Epoetin beta - Market size and forecast 2021-2026
Exhibit 32: Chart on Epoetin beta - Market size and forecast 2021-2026 ($ million)
Exhibit 33: Data Table on Epoetin beta - Market size and forecast 2021-2026 ($ million)
Exhibit 34: Chart on Epoetin beta - Year-over-year growth 2021-2026 (%)
Exhibit 35: Data Table on Epoetin beta - Year-over-year growth 2021-2026 (%)
5.5 Darbepoetin alfa - Market size and forecast 2021-2026
Exhibit 36: Chart on Darbepoetin alfa - Market size and forecast 2021-2026 ($ million)
Exhibit 37: Data Table on Darbepoetin alfa - Market size and forecast 2021-2026 ($ million)
Exhibit 38: Chart on Darbepoetin alfa - Year-over-year growth 2021-2026 (%)
Exhibit 39: Data Table on Darbepoetin alfa - Year-over-year growth 2021-2026 (%)
5.6 Others - Market size and forecast 2021-2026
Exhibit 40: Chart on Others - Market size and forecast 2021-2026 ($ million)
Exhibit 41: Data Table on Others - Market size and forecast 2021-2026 ($ million)
Exhibit 42: Chart on Others - Year-over-year growth 2021-2026 (%)
Exhibit 43: Data Table on Others - Year-over-year growth 2021-2026 (%)
5.7 Market opportunity by Type
Exhibit 44: Market opportunity by Type ($ million)
6 Customer Landscape
6.1 Customer landscape overview
Exhibit 45: Analysis of price sensitivity, lifecycle, customer purchase basket, adoption rates, and purchase criteria
7 Geographic Landscape
7.1 Geographic segmentation
Exhibit 46: Chart on Market share by geography 2021-2026 (%)
Exhibit 47: Data Table on Market share by geography 2021-2026 (%)
7.2 Geographic comparison
Exhibit 48: Chart on Geographic comparison
Exhibit 49: Data Table on Geographic comparison
7.3 North America - Market size and forecast 2021-2026
Exhibit 50: Chart on North America - Market size and forecast 2021-2026 ($ million)
Exhibit 51: Data Table on North America - Market size and forecast 2021-2026 ($ million)
Exhibit 52: Chart on North America - Year-over-year growth 2021-2026 (%)
Exhibit 53: Data Table on North America - Year-over-year growth 2021-2026 (%)
7.4 Europe - Market size and forecast 2021-2026
Exhibit 54: Chart on Europe - Market size and forecast 2021-2026 ($ million)
Exhibit 55: Data Table on Europe - Market size and forecast 2021-2026 ($ million)
Exhibit 56: Chart on Europe - Year-over-year growth 2021-2026 (%)
Exhibit 57: Data Table on Europe - Year-over-year growth 2021-2026 (%)
7.5 Asia - Market size and forecast 2021-2026
Exhibit 58: Chart on Asia - Market size and forecast 2021-2026 ($ million)
Exhibit 59: Data Table on Asia - Market size and forecast 2021-2026 ($ million)
Exhibit 60: Chart on Asia - Year-over-year growth 2021-2026 (%)
Exhibit 61: Data Table on Asia - Year-over-year growth 2021-2026 (%)
7.6 Rest of World (ROW) - Market size and forecast 2021-2026
Exhibit 62: Chart on Rest of World (ROW) - Market size and forecast 2021-2026 ($ million)
Exhibit 63: Data Table on Rest of World (ROW) - Market size and forecast 2021-2026 ($ million)
Exhibit 64: Chart on Rest of World (ROW) - Year-over-year growth 2021-2026 (%)
Exhibit 65: Data Table on Rest of World (ROW) - Year-over-year growth 2021-2026 (%)
7.7 US - Market size and forecast 2021-2026
Exhibit 66: Chart on US - Market size and forecast 2021-2026 ($ million)
Exhibit 67: Data Table on US - Market size and forecast 2021-2026 ($ million)
Exhibit 68: Chart on US - Year-over-year growth 2021-2026 (%)
Exhibit 69: Data Table on US - Year-over-year growth 2021-2026 (%)
7.8 Germany - Market size and forecast 2021-2026
Exhibit 70: Chart on Germany - Market size and forecast 2021-2026 ($ million)
Exhibit 71: Data Table on Germany - Market size and forecast 2021-2026 ($ million)
Exhibit 72: Chart on Germany - Year-over-year growth 2021-2026 (%)
Exhibit 73: Data Table on Germany - Year-over-year growth 2021-2026 (%)
7.9 UK - Market size and forecast 2021-2026
Exhibit 74: Chart on UK - Market size and forecast 2021-2026 ($ million)
Exhibit 75: Data Table on UK - Market size and forecast 2021-2026 ($ million)
Exhibit 76: Chart on UK - Year-over-year growth 2021-2026 (%)
Exhibit 77: Data Table on UK - Year-over-year growth 2021-2026 (%)
7.10 Canada - Market size and forecast 2021-2026
Exhibit 78: Chart on Canada - Market size and forecast 2021-2026 ($ million)
Exhibit 79: Data Table on Canada - Market size and forecast 2021-2026 ($ million)
Exhibit 80: Chart on Canada - Year-over-year growth 2021-2026 (%)
Exhibit 81: Data Table on Canada - Year-over-year growth 2021-2026 (%)
7.11 China - Market size and forecast 2021-2026
Exhibit 82: Chart on China - Market size and forecast 2021-2026 ($ million)
Exhibit 83: Data Table on China - Market size and forecast 2021-2026 ($ million)
Exhibit 84: Chart on China - Year-over-year growth 2021-2026 (%)
Exhibit 85: Data Table on China - Year-over-year growth 2021-2026 (%)
7.12 Market opportunity by geography
Exhibit 86: Market opportunity by geography ($ million)
8 Drivers, Challenges, and Trends
8.1 Market drivers
8.2 Market challenges
8.3 Impact of drivers and challenges
Exhibit 87: Impact of drivers and challenges in 2021 and 2026
8.4 Market trends
9 Vendor Landscape
9.1 Overview
9.2 Vendor landscape
Exhibit 88: Overview on Criticality of inputs and Factors of differentiation
9.3 Landscape disruption
Exhibit 89: Overview on factors of disruption
9.4 Industry risks
Exhibit 90: Impact of key risks on business
10 Vendor Analysis
10.1 Vendors covered
Exhibit 91: Vendors covered
10.2 Market positioning of vendors
Exhibit 92: Matrix on vendor position and classification
Exhibit 93: Akebia Therapeutics Inc. - Overview
Exhibit 94: Akebia Therapeutics Inc. - Product / Service
Exhibit 95: Akebia Therapeutics Inc. - Key offerings
10.4 Amgen Inc.
Exhibit 96: Amgen Inc. - Overview
Exhibit 97: Amgen Inc. - Product / Service
Exhibit 98: Amgen Inc. - Key offerings
10.5 Biocon Ltd.
Exhibit 99: Biocon Ltd. - Overview
Exhibit 100: Biocon Ltd. - Business segments
Exhibit 101: Biocon Ltd. - Key offerings
Exhibit 102: Biocon Ltd. - Segment focus
10.6 Biosidus SA
Exhibit 103: Biosidus SA - Overview
Exhibit 104: Biosidus SA - Product / Service
Exhibit 105: Biosidus SA - Key offerings
Exhibit 106: F. Hoffmann La Roche Ltd. - Overview
Exhibit 107: F. Hoffmann La Roche Ltd. - Business segments
Exhibit 108: F. Hoffmann La Roche Ltd. - Key news
Exhibit 109: F. Hoffmann La Roche Ltd. - Key offerings
Exhibit 110: F. Hoffmann La Roche Ltd. - Segment focus
10.8 Johnson and Johnson
Exhibit 111: Johnson and Johnson - Overview
Exhibit 112: Johnson and Johnson - Business segments
Exhibit 113: Johnson and Johnson - Key news
Exhibit 114: Johnson and Johnson - Key offerings
Exhibit 115: Johnson and Johnson - Segment focus
Exhibit 116: Nanogen Pharmaceutical Biotechnology - Overview
Exhibit 117: Nanogen Pharmaceutical Biotechnology - Product / Service
Exhibit 118: Nanogen Pharmaceutical Biotechnology - Key offerings
10.10 Novartis AG
Exhibit 119: Novartis AG - Overview
Exhibit 120: Novartis AG - Business segments
Exhibit 121: Novartis AG - Key offerings
Exhibit 122: Novartis AG - Segment focus
10.11 Pfizer Inc.
Exhibit 123: Pfizer Inc. - Overview
Exhibit 124: Pfizer Inc. - Product / Service
Exhibit 125: Pfizer Inc. - Key news
Exhibit 126: Pfizer Inc. - Key offerings
Exhibit 127: Thermo Fisher Scientific Inc. - Overview
Exhibit 128: Thermo Fisher Scientific Inc. - Business segments
Exhibit 129: Thermo Fisher Scientific Inc. - Key news
Exhibit 130: Thermo Fisher Scientific Inc. - Key offerings
Exhibit 131: Thermo Fisher Scientific Inc. - Segment focus
11.1 Scope of the report
11.2 Inclusions and exclusions checklist
Exhibit 132: Inclusions checklist
Exhibit 133: Exclusions checklist
11.3 Currency conversion rates for US$
Exhibit 134: Currency conversion rates for US$
11.4 Research methodology
Exhibit 135: Research methodology
Exhibit 136: Validation techniques employed for market sizing
Exhibit 137: Information sources
11.5 List of abbreviations
Exhibit 138: List of abbreviations
About Us
Technavio is a leading global technology research and advisory company. Their research and analysis focus on emerging market trends and provides actionable insights to help businesses identify market opportunities and develop effective strategies to optimize their market positions. With over 500 specialized analysts, Technavio's report library consists of more than 17,000 reports and counting, covering 800 technologies, spanning across 50 countries. Their client base consists of enterprises of all sizes, including more than 100 Fortune 500 companies. This growing client base relies on Technavio's comprehensive coverage, extensive research, and actionable market insights to identify opportunities in existing and potential markets and assess their competitive positions within changing market scenarios.
Contact
Technavio Research
Jesse Maida
US: +1 844 364 1100
UK: +44 203 893 3200
Email: [email protected]
Website: www.technavio.com/
SOURCE Technavio
For more details,please visit the original website
The content of the article does not represent any opinions of Synapse and its affiliated companies. If there is any copyright infringement or error, please contact us, and we will deal with it within 24 hours.
Organizations
Indications
Targets
Hot reports


Get started for free today!
Accelerate Strategic R&D decision making with Synapse, PatSnap’s AI-powered Connected Innovation Intelligence Platform Built for Life Sciences Professionals.
Start your data trial now!
Synapse data is also accessible to external entities via APIs or data packages. Leverages most recent intelligence information, enabling fullest potential.