Last update 19 Sep 2024
Breg, Inc.
Last update 19 Sep 2024
Overview
Related
4
Clinical Trials associated with Breg, Inc.In Vivo Three-Dimensional Determination of Osteoarthritis Brace Effectiveness
In vivo knee kinematics will be assessed for 20 subjects that have been clinically diagnosed with substantial unicompartmental osteoarthritis (OA) by one of the surgeons of Colorado Joint Replacement; this is the location from which participants will be recruited. The objective of this study will be to analyze subjects with symptomatic unicompartmental osteoarthritis under in vivo dynamic, weight-bearing conditions using video fluoroscopy to determine if present-day OA knee braces provide separation of the femoral condyle from the tibial plateau, thus avoiding excessive loads on the degenerative compartment.
Start Date12 Jul 2019 |
Sponsor / Collaborator |
Effect of Augmenting a Standard Total Knee Pathway Protocol With a 12-week Peri-Operative Program of BREG Flex
Patient outcomes following total knee replacement and standard physical therapy will be compared between subjects who use the Breg Flex study device vs those who do not. Subjects will be evaluated for knee range of motion, strength and patient reported outcomes.
Start Date01 Jun 2018 |
Sponsor / Collaborator |
Efficacy of Medial Compartment Unloading Brace Use for Osteoarthritis of the the Knee: A Prospective Randomized Study
Subjects with symptomatic unicompartmental osteoarthritis of the knee will be invited to participate in this randomized study. Subjects will be assigned to either a Fusion Osteoarthritis Knee Brace group, or a control group that does not wear a brace. It is hypothesized that use of the Fusion Osteoarthritis Knee Brace will have a better outcome on osteoarthritis knee pain and quality of life compared to those who do not receive bracing intervention.
Start Date01 Feb 2010 |
Sponsor / Collaborator  Andrews Research & Education Foundation, Inc.Startup Andrews Research & Education Foundation, Inc.Startup [+1] |
100 Clinical Results associated with Breg, Inc.
Login to view more data
0 Patents (Medical) associated with Breg, Inc.
Login to view more data
1
Literatures (Medical) associated with Breg, Inc.01 Jul 2003·Foot & Ankle InternationalQ2 · MEDICINE
Physiologic Axial Load, Frictional Resistance, and the Football Shoe—Surface Interface
Q2 · MEDICINE
Article
Author: Scranton, Pierce E. ; Heidt, Robert S. ; Cawley, Patrick W. ; Howard, Mark E. ; Losse, Gary M.
5
News (Medical) associated with Breg, Inc.08 Jan 2024
TAMPA, Fla.--(BUSINESS WIRE)-- Leixir Dental Laboratory Group (Leixir), a leading operator of a full-service, state-of-the-art dental laboratory network, today announced the appointment of John Krier as Chief Executive Officer, effective January 2nd, 2024. Mr. Krier succeeds Leixir founder Harmeet Bindra, who will continue as Executive Chairman.
Mr. Krier brings nearly two decades of executive leadership experience in the medical device manufacturing and distribution industries. He joins Leixir from Dynatronics Corporation (NASDAQ: DYNT), where he was most recently President and CEO. Before that, he held senior roles in corporate strategy and commercial execution, including marketing and customer experience, over seven years at Breg, Inc. Prior to that, Mr. Krier was President of Viscent, LLC. He began his career at Deloitte, where he served in a variety of client servicing positions over eight years with the firm.
“We are delighted to welcome John to Leixir,” said Mr. Bindra. “His wealth of multidisciplinary experience spans operations, new product launches, strategic acquisitions, customer-focused strategies, and team development. With a long track record of developing values-based company culture and driving operational excellence, John is well-suited to lead Leixir in its next phase of expansion.”
“John’s impressive leadership record, entrepreneurial mindset and healthcare experience will serve Leixir well in our ongoing commitment to providing industry leading service to dental service organizations (DSOs) as well as independent dentists,” said Marshall Griffin, a member of Leixir’s Board of Directors and a Partner of Comvest Partners, a private equity firm.
Said Mr. Krier: "I am honored for the opportunity to work alongside Leixir’s terrific leadership team and employees at such an exciting time. Leixir is well-positioned for strong continued growth as a dental lab provider of choice. I look forward to continuing to expand Leixir’s customer base, advance its DSO relationships and grow its service offering in support of best-in-class dental patient care.”
About Leixir Dental Laboratory Group
Leixir operates a network of full-service, state-of-the-art dental laboratories that offer a complete range of leading-edge dental products, including crowns and bridges, implants, surgical guides, and dentures. Leixir’s laboratories are strategically located to provide superior service to dentists throughout the United States. Leixir has built a digital-first service model to support its delivery of differentiated services and technology throughout the dental landscape. For more information, please visit .
Executive Change
06 Jul 2023
None
Welcome to this week's Chutes & Ladders, our roundup of hirings, firings and retirings throughout the industry. Please submit the good news—or the bad—from your shop, and we will feature it here at the end of each week.
Prime Therapeutics
Mostafa Kamal will succeed Ken Paulus as president and chief executive officer of Prime Therapeutics.
Currently, Kamal fills the role of president of the pharmacy benefit manager and the CEO of Magellan Rx, a Prime Therapeutics company. Paulus has led the company for the past five years after joining the PBM from Breg where he held the position of director. Paulus previously had the same title at Teladoc and AllyAlign Health.
Kamal first joined Magellan in the strategy, underwriting and analytics department before being named senior vice president, general manager and specialty and chief underwriting officer. He cut his teeth in the area while working at Express Scripts. He played a key role in shaping the 2022 agreement that merged Magellan and Prime, according to the companies.
American Academy of Physician Associates
Folusho Ogunfiditimi will lead the American Academy of Physician Associates (AAPA) as president and chair of the board.
Ogunfiditimi joined AAPA’s Student Academy as a physician associate student over two decades ago. He has spent that time working as a PA in urology. He has also taught in the Doctor of Medical Sciences program at Butler University and held administrative roles in practice management at Florida Healthcare Plans.
Previously, Ogunfiditimi held other administrative roles including associate administrator of the Detroit Medical Center in its cardiovascular institute and administrative director at its adult clinical services and advanced practice providers department. Before moving to DMC, he held managerial positions at Henry Ford Health System.
Talkiatry
Eric Triana has joined Talkiatry as chief compliance officer for the virtual mental health provider.
Triana spent more than twenty years at the Drug Enforcement Administration (DEA) before joining Talkiatry. For the previous 13 years, he has worked in several diversion control program positions as a part of the administration’s regulatory division. Before retiring from the governmental office this March, he held the position of diversion control division deputy assistant administrator.
While at the DEA, Triana helped design programs to identify and detect healthcare industry violators of federal and state laws, including the federal Controlled Substances Act, the Anti-Kickback Statue and the False Claims Act. Triana began his career as a police officer and detective for the Baltimore City Police Department.
"Telepsychiatry has completely changed mental health care in this country, and Talkiatry is at the forefront of bringing access to populations who were previously ignored," said Triana. "With my decades of compliance and regulatory experience, I will ensure that Talkiatry's psychiatrists are always informed and supported in a constantly changing world with confusing and often conflicting information, so they can focus on delivering high-quality support to people across the U.S."
UC Davis Health
Dennis Chornenky has been named the inaugural chief artificial intelligence adviser at UC Davis Health, based in Sacramento, California.
Along with his consulting and technology firm Domelabs AI, Chornenky will lead the establishment of AI strategy at UC Davis Health. He will prioritize key initiatives through the AI and digital systems advisory council and oversee data shared to ensure AI usage within the system is safe and ethical.
Chornenky was previously senior adviser and strategy consultant in artificial intelligence and emerging technology for the White House. He holds over 20 years of business strategizing at the intersection of healthcare and technology with a focus on AI governance. He has also held senior positions at UnitedHealth Group and Morgan Stanley.
> Confluent Health welcomed Kristi Henderson as the company’s new chief executive officer.
> Broward Health said goodbye to Joshua Lenchus who left his position as chief medical officer of the health system.
> CommonSpirit Health promoted Nancy Bussani to executive vice president and chief philanthropy officer as well as president of the CommonSpirit Health Foundation.
> EMD Serono has named Miguel Fernández Alcalde as its chief operating officer for the U.S.
> Homeward welcomed Centene executive Brent Layton to its board of directors.
> Independence Blue Cross promoted Daniel Brown to vice president of provider reimbursement analysis and administration, Michael Hébert to vice president of provider contracting and Obadiah Sang to vice president of corporate development and strategic investments.
> Isomorphic Labs welcomed Pamela Carroll, Ph.D., as its new chief operating officer.
> The Association of American Medical Colleges named its 2023-24 board of directors. Lee Jones, M.D., dean for medical education at Georgetown University School of Medicine, has been elected to serve as chair. Julie A. Freischlag, M.D., chief academic officer and executive vice president of Advocate Health, has been named chair-elect and will succeed Jones next year.

Executive Change
13 Feb 2023
NEW YORK, Feb. 13, 2023 /PRNewswire/ -- The
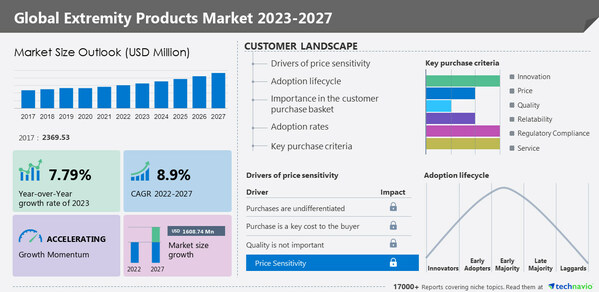
Extremity Products Market by Type, End-user, and Geography - Forecast and Analysis 2023-2027 report has been published by Technavio. Market growth is estimated to accelerate at a
CAGR of 8.9% and register an incremental growth of
USD 1,608.74 million during the forecast period. The report includes historic market data from 2017 to 2021. In 2017, the extremity products market was valued at
USD 2,369.53 million. The report provides a comprehensive analysis of growth opportunities at regional levels, new product launches, the latest trends, and the post-pandemic recovery of the global market.
Download a PDF Sample Report
Continue Reading
Technavio has announced its latest market research report titled Global Extremity Products Market 2023-2027
Regional Analysis
By region, the global extremity products market is segmented into
North America, Europe, Asia, and the Rest of World (ROW). North America will account for 30% of the market's growth during the forecast period. The presence of well-equipped and established healthcare infrastructure, the availability of highly skilled professionals, and the presence of extensive healthcare insurance coverage are driving the growth of the regional market.
Company Profiles
The extremity products market report includes information on the key products and recent developments of leading vendors, including:
Acumed LLC: The company offers an extremity screw system that is designed for fracture and osteotomy fixation of the upper and lower extremities.
Bone Foam Inc: The company offers RAN 11 bone marrow aspiration needles which are designed to withdraw a sample of fluid during bone marrow operation.
Conmed Corp: The company offers an Aligner PHX humeral fracture brace which is designed to control and correct bone alignment during the healing process without the need for surgery.
Exactech Inc: The company offers disposable cannulas which help surgeons to prevent suture entanglement and allow visualization of arthroscopic knots to address surgical treatment
Extremity Medical LLC: The company offers EPIC extremity foot and ankle reconstruction systems that allow surgeons to mix and match screws and plates based on implant preferences and surgical needs.
In2Bones Corp.
Johnson and Johnson Services Inc.
Owens and Minor Inc.
Skeletal Dynamics LLC
Smith and Nephew plc
TriMed Inc.
Waldemar Link GmbH and Co. KG
To gain access to more vendor profiles available with Technavio,
buy the report!
Market Dynamics
The market is driven by factors such as the rising prevalence of orthopedic conditions, the rising investment and awareness, and the growing geriatric population. However, the high cost of extremity procedures is hindering the market growth.
Competitive Analysis
The competitive scenario categorizes companies based on various performance indicators. Some of the factors considered include the financial performance of companies over the past few years, growth strategies, product innovations, new product launches, investments, and growth in market share, among others.
Request a Sample
Market Segmentation
By type, the market is segmented into
upper extremities and lower extremities. The
upper extremities segment accounted for the largest share of the market.
By geography, the market is segmented into
North America, Europe, Asia, and the Rest of World (ROW).
North America held the largest share of the market.
Related Reports:
Self-tan Products Market by Distribution Channel, Product and Geography - Forecast and Analysis 2023-2027: The self-tan products market is estimated to grow at a
CAGR of 4.55% between 2022 and 2027. The size of the market is forecast to increase by
USD 197.83 million. The availability of self-tan products with multiple benefits is notably driving the market growth, although factors such as increasing substitutes for commercially manufactured self-tan products may impede the market growth.
Facial Care Products Market by Product, Distribution Channel and Geography - Forecast and Analysis 2023-2027: The facial care products market is estimated to
grow at a CAGR of 5.74% between 2022 and 2027. The size of the market is forecast to increase by
USD 32.86 billion. Modern-day lifestyle changes and growing facial skin-related issues are notably driving the market growth, although factors such as the easy availability of counterfeit products may impede the market growth.
Technavio's library includes over 17,000+ reports, covering more than 2,000 emerging technologies.
Subscribe to our "Basic Plan" at just USD 5,000 and get lifetime access to Technavio Insights
What are the key data covered in this extremity products market report?
CAGR of the market during the forecast period
Detailed information on factors that will drive the growth of the extremity products market between 2023 and 2027
Precise estimation of the size of the extremity products market and its contribution to the parent market
Accurate predictions about upcoming trends and changes in consumer behavior
Growth of the extremity products market across North America, Europe, Asia, and the Rest of World (ROW)
A thorough analysis of the market's competitive landscape and detailed information about vendors
Comprehensive analysis of factors that will challenge the growth of extremity products market vendors
Browse for Technavio "Consumer Staples" Research Reports
Table of Contents
1 Executive Summary
1.1 Market overview
Exhibit 01: Executive Summary – Chart on Market Overview
Exhibit 02: Executive Summary – Data Table on Market Overview
Exhibit 03: Executive Summary – Chart on Global Market Characteristics
Exhibit 04: Executive Summary – Chart on Market by Geography
Exhibit 05: Executive Summary – Chart on Market Segmentation by Type
Exhibit 06: Executive Summary – Chart on Market Segmentation by End-user
Exhibit 07: Executive Summary – Chart on Incremental Growth
Exhibit 08: Executive Summary – Data Table on Incremental Growth
Exhibit 09: Executive Summary – Chart on Vendor Market Positioning
2 Market Landscape
2.1 Market ecosystem
Exhibit 10: Parent market
Exhibit 11: Market Characteristics
3 Market Sizing
3.1 Market definition
Exhibit 12: Offerings of vendors included in the market definition
3.2 Market segment analysis
Exhibit 13: Market segments
3.3 Market size 2022
3.4 Market outlook: Forecast for 2022-2027
Exhibit 14: Chart on Global - Market size and forecast 2022-2027 ($ million)
Exhibit 15: Data Table on Global - Market size and forecast 2022-2027 ($ million)
Exhibit 16: Chart on Global Market: Year-over-year growth 2022-2027 (%)
Exhibit 17: Data Table on Global Market: Year-over-year growth 2022-2027 (%)
4 Historic Market Size
4.1 Global extremity products market 2017 - 2021
Exhibit 18: Historic Market Size – Data Table on Global extremity products market 2017 - 2021 ($ million)
4.2 Type Segment Analysis 2017 - 2021
Exhibit 19: Historic Market Size – Type Segment 2017 - 2021 ($ million)
4.3 End-User Segment Analysis 2017 - 2021
Exhibit 20: Historic Market Size – End-User Segment 2017 - 2021 ($ million)
4.4 Geography Segment Analysis 2017 - 2021
Exhibit 21: Historic Market Size – Geography Segment 2017 - 2021 ($ million)
4.5 Country Segment Analysis 2017 - 2021
Exhibit 22: Historic Market Size – Country Segment 2017 - 2021 ($ million)
5 Five Forces Analysis
5.1 Five forces summary
Exhibit 23: Five forces analysis - Comparison between 2022 and 2027
5.2 Bargaining power of buyers
Exhibit 24: Chart on Bargaining power of buyers – Impact of key factors 2022 and 2027
5.3 Bargaining power of suppliers
Exhibit 25: Bargaining power of suppliers – Impact of key factors in 2022 and 2027
5.4 Threat of new entrants
Exhibit 26: Threat of new entrants – Impact of key factors in 2022 and 2027
5.5 Threat of substitutes
Exhibit 27: Threat of substitutes – Impact of key factors in 2022 and 2027
5.6 Threat of rivalry
Exhibit 28: Threat of rivalry – Impact of key factors in 2022 and 2027
5.7 Market condition
Exhibit 29: Chart on Market condition - Five forces 2022 and 2027
6 Market Segmentation by Type
6.1 Market segments
Exhibit 30: Chart on Type - Market share 2022-2027 (%)
Exhibit 31: Data Table on Type - Market share 2022-2027 (%)
6.2 Comparison by Type
Exhibit 32: Chart on Comparison by Type
Exhibit 33: Data Table on Comparison by Type
6.3 Upper extremities - Market size and forecast 2022-2027
Exhibit 34: Chart on Upper extremities - Market size and forecast 2022-2027 ($ million)
Exhibit 35: Data Table on Upper extremities - Market size and forecast 2022-2027 ($ million)
Exhibit 36: Chart on Upper extremities - Year-over-year growth 2022-2027 (%)
Exhibit 37: Data Table on Upper extremities - Year-over-year growth 2022-2027 (%)
6.4 Lower extremities - Market size and forecast 2022-2027
Exhibit 38: Chart on Lower extremities - Market size and forecast 2022-2027 ($ million)
Exhibit 39: Data Table on Lower extremities - Market size and forecast 2022-2027 ($ million)
Exhibit 40: Chart on Lower extremities - Year-over-year growth 2022-2027 (%)
Exhibit 41: Data Table on Lower extremities - Year-over-year growth 2022-2027 (%)
6.5 Market opportunity by Type
Exhibit 42: Market opportunity by Type ($ million)
7 Market Segmentation by End-user
7.1 Market segments
Exhibit 43: Chart on End-user - Market share 2022-2027 (%)
Exhibit 44: Data Table on End-user - Market share 2022-2027 (%)
7.2 Comparison by End-user
Exhibit 45: Chart on Comparison by End-user
Exhibit 46: Data Table on Comparison by End-user
7.3 Hospitals - Market size and forecast 2022-2027
Exhibit 47: Chart on Hospitals - Market size and forecast 2022-2027 ($ million)
Exhibit 48: Data Table on Hospitals - Market size and forecast 2022-2027 ($ million)
Exhibit 49: Chart on Hospitals - Year-over-year growth 2022-2027 (%)
Exhibit 50: Data Table on Hospitals - Year-over-year growth 2022-2027 (%)
7.4 Clinics - Market size and forecast 2022-2027
Exhibit 51: Chart on Clinics - Market size and forecast 2022-2027 ($ million)
Exhibit 52: Data Table on Clinics - Market size and forecast 2022-2027 ($ million)
Exhibit 53: Chart on Clinics - Year-over-year growth 2022-2027 (%)
Exhibit 54: Data Table on Clinics - Year-over-year growth 2022-2027 (%)
7.5 ASCs - Market size and forecast 2022-2027
Exhibit 55: Chart on ASCs - Market size and forecast 2022-2027 ($ million)
Exhibit 56: Data Table on ASCs - Market size and forecast 2022-2027 ($ million)
Exhibit 57: Chart on ASCs - Year-over-year growth 2022-2027 (%)
Exhibit 58: Data Table on ASCs - Year-over-year growth 2022-2027 (%)
7.6 Market opportunity by End-user
Exhibit 59: Market opportunity by End-user ($ million)
8 Customer Landscape
8.1 Customer landscape overview
Exhibit 60: Analysis of price sensitivity, lifecycle, customer purchase basket, adoption rates, and purchase criteria
9 Geographic Landscape
9.1 Geographic segmentation
Exhibit 61: Chart on Market share by geography 2022-2027 (%)
Exhibit 62: Data Table on Market share by geography 2022-2027 (%)
9.2 Geographic comparison
Exhibit 63: Chart on Geographic comparison
Exhibit 64: Data Table on Geographic comparison
9.3 North America - Market size and forecast 2022-2027
Exhibit 65: Chart on North America - Market size and forecast 2022-2027 ($ million)
Exhibit 66: Data Table on North America - Market size and forecast 2022-2027 ($ million)
Exhibit 67: Chart on North America - Year-over-year growth 2022-2027 (%)
Exhibit 68: Data Table on North America - Year-over-year growth 2022-2027 (%)
9.4 Europe - Market size and forecast 2022-2027
Exhibit 69: Chart on Europe - Market size and forecast 2022-2027 ($ million)
Exhibit 70: Data Table on Europe - Market size and forecast 2022-2027 ($ million)
Exhibit 71: Chart on Europe - Year-over-year growth 2022-2027 (%)
Exhibit 72: Data Table on Europe - Year-over-year growth 2022-2027 (%)
9.5 Asia - Market size and forecast 2022-2027
Exhibit 73: Chart on Asia - Market size and forecast 2022-2027 ($ million)
Exhibit 74: Data Table on Asia - Market size and forecast 2022-2027 ($ million)
Exhibit 75: Chart on Asia - Year-over-year growth 2022-2027 (%)
Exhibit 76: Data Table on Asia - Year-over-year growth 2022-2027 (%)
9.6 Rest of World (ROW) - Market size and forecast 2022-2027
Exhibit 77: Chart on Rest of World (ROW) - Market size and forecast 2022-2027 ($ million)
Exhibit 78: Data Table on Rest of World (ROW) - Market size and forecast 2022-2027 ($ million)
Exhibit 79: Chart on Rest of World (ROW) - Year-over-year growth 2022-2027 (%)
Exhibit 80: Data Table on Rest of World (ROW) - Year-over-year growth 2022-2027 (%)
9.7 US - Market size and forecast 2022-2027
Exhibit 81: Chart on US - Market size and forecast 2022-2027 ($ million)
Exhibit 82: Data Table on US - Market size and forecast 2022-2027 ($ million)
Exhibit 83: Chart on US - Year-over-year growth 2022-2027 (%)
Exhibit 84: Data Table on US - Year-over-year growth 2022-2027 (%)
9.8 UK - Market size and forecast 2022-2027
Exhibit 85: Chart on UK - Market size and forecast 2022-2027 ($ million)
Exhibit 86: Data Table on UK - Market size and forecast 2022-2027 ($ million)
Exhibit 87: Chart on UK - Year-over-year growth 2022-2027 (%)
Exhibit 88: Data Table on UK - Year-over-year growth 2022-2027 (%)
9.9 Canada - Market size and forecast 2022-2027
Exhibit 89: Chart on Canada - Market size and forecast 2022-2027 ($ million)
Exhibit 90: Data Table on Canada - Market size and forecast 2022-2027 ($ million)
Exhibit 91: Chart on Canada - Year-over-year growth 2022-2027 (%)
Exhibit 92: Data Table on Canada - Year-over-year growth 2022-2027 (%)
9.10 China - Market size and forecast 2022-2027
Exhibit 93: Chart on China - Market size and forecast 2022-2027 ($ million)
Exhibit 94: Data Table on China - Market size and forecast 2022-2027 ($ million)
Exhibit 95: Chart on China - Year-over-year growth 2022-2027 (%)
Exhibit 96: Data Table on China - Year-over-year growth 2022-2027 (%)
9.11 India - Market size and forecast 2022-2027
Exhibit 97: Chart on India - Market size and forecast 2022-2027 ($ million)
Exhibit 98: Data Table on India - Market size and forecast 2022-2027 ($ million)
Exhibit 99: Chart on India - Year-over-year growth 2022-2027 (%)
Exhibit 100: Data Table on India - Year-over-year growth 2022-2027 (%)
9.12 Market opportunity by geography
Exhibit 101: Market opportunity by geography ($ million)
10 Drivers, Challenges, and Trends
10.1 Market drivers
10.2 Market challenges
10.3 Impact of drivers and challenges
Exhibit 102: Impact of drivers and challenges in 2022 and 2027
10.4 Market trends
11 Vendor Landscape
11.1 Overview
11.2 Vendor landscape
Exhibit 103: Overview on Criticality of inputs and Factors of differentiation
11.3 Landscape disruption
Exhibit 104: Overview on factors of disruption
11.4 Industry risks
Exhibit 105: Impact of key risks on business
12 Vendor Analysis
12.1 Vendors covered
Exhibit 106: Vendors covered
12.2 Market positioning of vendors
Exhibit 107: Matrix on vendor position and classification
12.3 3-Point Products
Exhibit 108: 3-Point Products - Overview
Exhibit 109: 3-Point Products - Product / Service
Exhibit 110: 3-Point Products - Key offerings
12.4 Acumed LLC
Exhibit 111: Acumed LLC - Overview
Exhibit 112: Acumed LLC - Product / Service
Exhibit 113: Acumed LLC - Key offerings
12.5 Arthrex Inc.
Exhibit 114: Arthrex Inc. - Overview
Exhibit 115: Arthrex Inc. - Product / Service
Exhibit 116: Arthrex Inc. - Key offerings
12.6 Aspire Medical Innovation
Exhibit 117: Aspire Medical Innovation - Overview
Exhibit 118: Aspire Medical Innovation - Product / Service
Exhibit 119: Aspire Medical Innovation - Key offerings
12.7 Breg Inc.
Exhibit 120: Breg Inc. - Overview
Exhibit 121: Breg Inc. - Product / Service
Exhibit 122: Breg Inc. - Key offerings
12.8 Conmed Corp.
Exhibit 123: Conmed Corp. - Overview
Exhibit 124: Conmed Corp. - Business segments
Exhibit 125: Conmed Corp. - Key offerings
Exhibit 126: Conmed Corp. - Segment focus
12.9 Exactech Inc.
Exhibit 127: Exactech Inc. - Overview
Exhibit 128: Exactech Inc. - Product / Service
Exhibit 129: Exactech Inc. - Key offerings
12.10 Extremity Medical LLC
Exhibit 130: Extremity Medical LLC - Overview
Exhibit 131: Extremity Medical LLC - Product / Service
Exhibit 132: Extremity Medical LLC - Key offerings
12.11 In2Bones Corp.
Exhibit 133: In2Bones Corp. - Overview
Exhibit 134: In2Bones Corp. - Product / Service
Exhibit 135: In2Bones Corp. - Key offerings
12.12 Johnson and Johnson Services Inc.
Exhibit 136: Johnson and Johnson Services Inc. - Overview
Exhibit 137: Johnson and Johnson Services Inc. - Business segments
Exhibit 138: Johnson and Johnson Services Inc. - Key news
Exhibit 139: Johnson and Johnson Services Inc. - Key offerings
Exhibit 140: Johnson and Johnson Services Inc. - Segment focus
12.13 Skeletal Dynamics LLC
Exhibit 141: Skeletal Dynamics LLC - Overview
Exhibit 142: Skeletal Dynamics LLC - Product / Service
Exhibit 143: Skeletal Dynamics LLC - Key offerings
12.14 Smith and Nephew plc
Exhibit 144: Smith and Nephew plc - Overview
Exhibit 145: Smith and Nephew plc - Business segments
Exhibit 146: Smith and Nephew plc - Key news
Exhibit 147: Smith and Nephew plc - Key offerings
Exhibit 148: Smith and Nephew plc - Segment focus
12.15 Stryker Corp.
Exhibit 149: Stryker Corp. - Overview
Exhibit 150: Stryker Corp. - Business segments
Exhibit 151: Stryker Corp. - Key news
Exhibit 152: Stryker Corp. - Key offerings
Exhibit 153: Stryker Corp. - Segment focus
12.16 Wright Medical Group NV
Exhibit 154: Wright Medical Group NV - Overview
Exhibit 155: Wright Medical Group NV - Business segments
Exhibit 156: Wright Medical Group NV - Key offerings
Exhibit 157: Wright Medical Group NV - Segment focus
12.17 Zimmer Biomet Holdings Inc.
Exhibit 158: Zimmer Biomet Holdings Inc. - Overview
Exhibit 159: Zimmer Biomet Holdings Inc. - Business segments
Exhibit 160: Zimmer Biomet Holdings Inc. - Key news
Exhibit 161: Zimmer Biomet Holdings Inc. - Key offerings
Exhibit 162: Zimmer Biomet Holdings Inc. - Segment focus
13 Appendix
13.1 Scope of the report
13.2 Inclusions and exclusions checklist
Exhibit 163: Inclusions checklist
Exhibit 164: Exclusions checklist
13.3 Currency conversion rates for US$
Exhibit 165: Currency conversion rates for US$
13.4 Research methodology
Exhibit 166: Research methodology
Exhibit 167: Validation techniques employed for market sizing
Exhibit 168: Information sources
13.5 List of abbreviations
Exhibit 169: List of abbreviations
About Us
Technavio is a leading global technology research and advisory company. Their research and analysis focus on emerging market trends and provides actionable insights to help businesses identify market opportunities and develop effective strategies to optimize their market positions. With over 500 specialized analysts, Technavio's report library consists of more than 17,000 reports and counting, covering 800 technologies, spanning across 50 countries. Their client base consists of enterprises of all sizes, including more than 100 Fortune 500 companies. This growing client base relies on Technavio's comprehensive coverage, extensive research, and actionable market insights to identify opportunities in existing and potential markets and assess their competitive positions within changing market scenarios.
Contact
Technavio Research
Jesse Maida
Media & Marketing Executive
US: +1 844 364 1100
UK: +44 203 893 3200
Email: [email protected]
Website:
SOURCE Technavio
100 Deals associated with Breg, Inc.
Login to view more data
100 Translational Medicine associated with Breg, Inc.
Login to view more data
Corporation Tree
Boost your research with our corporation tree data.
login
or
Pipeline
Pipeline Snapshot as of 06 Oct 2024
No data posted
Login to keep update
Deal
Boost your decision using our deal data.
login
or
Translational Medicine
Boost your research with our translational medicine data.
login
or
Profit
Explore the financial positions of over 360K organizations with Synapse.
login
or
Grant & Funding(NIH)
Access more than 2 million grant and funding information to elevate your research journey.
login
or
Investment
Gain insights on the latest company investments from start-ups to established corporations.
login
or
Financing
Unearth financing trends to validate and advance investment opportunities.
login
or
Chat with Hiro
Get started for free today!
Accelerate Strategic R&D decision making with Synapse, PatSnap’s AI-powered Connected Innovation Intelligence Platform Built for Life Sciences Professionals.
Start your data trial now!
Synapse data is also accessible to external entities via APIs or data packages. Empower better decisions with the latest in pharmaceutical intelligence.
Bio
Bio Sequences Search & Analysis
Sign up for free
Chemical
Chemical Structures Search & Analysis
Sign up for free